Introduction.
Most of the indicators currently used by traders in the Forex market were created for another market - the stock market and for another time, when there were quite monotonous trends and quotes were not so volatile as at present, when there are no trends as steady trends of unidirectional price movement. Therefore, the entire existing arsenal of indicators is not very suitable for trading in the Forex market and does not reflect the key moments of the state of this market. To assess the condition of the Forex market and its instruments, it is necessary first of all to analyze statistical histories of their quotations, which allows identifying patterns that are important for trade, which are latent for the standard indicators (supplied with the MT4 trading platform). One of these, providing a deep statistical analysis of instruments is the indicator PDA, which, based on the analysis of the smaller time frames, calculates in real time the probability distribution of the price for the larger time frames, and also calculates the asymmetry of this distribution. The visual control of probability distributions and asymmetry, which provides the indicator PDA, allows us to achieve a deeper understanding of the modern market, namely:
{C}1) statistically strictly identify the current price levels and assess the probabilities of the current (for the current moment) price in other segments of its fluctuations;
{C}2) to reveal the microstructure of the true trend movement, as a sequence of such transitions from one price level to another, that have a certain shift in the balance of probabilities towards the growth of the price or its fall;
{C}3) establish the beginning of a new trend movement based on the critical output of an non-lagging average beyond the current price level and exceeding the certain level of asymmetry.
1. Principles of the indicator.
1.1. Calculation of the probability distribution.
To calculate the probability distributions on time frames М5-Н4, the data of the minute chart - М1, is used. For the daily is used time frame M5; for the weekly time frame and for the monthly time frame - M30. The use of smaller time frames for estimating the probability distribution in these large time frames is not advisable, and it is impossible not only because of the braking of the program loaded with large arrays, but also because there is not enough big of M1 history in (for calculating probability densities) the scales of such graphs. Therefore, before the indicator PDA is installed on the chart of a tool, you first need to load the history (Tools / History Center) quotes for this tool, and also to increase to the limit the options "Max bars in history " and "Max bars in the chart" (Tools /Options / Charts). Note that if on some large-scale timeframe of data for calculating the probability distribution is not enough, on the "Experts" tab of the window of the term MT4 there will be a message "Downloadthequotationhistoryof… ". Indicator itself is resource-intensive and requires at least a 4-core processor 2.8 GHz and 4.00 GB of RAM. If the indicator will brake the MT4 terminal, then in the indicator settings it is necessary to reduce the «Number of countable bars of the current chart (<=200)», which is the default 200.
The calculated probability distribution and asymmetry has a sliding character, and the interval used for calculating the data is determined by the input parameter «The averaging period in the bars of the current graph», which we denote IS; if, for example, IS = 15, and time frame H4, then the columns of probability values corresponding to the time moments at H4 are calculated by 15 * 4 * 60 = 3600 points of the graph M1, i.e. the last column (zero bar n = 0 to H4) - over the last 3600 points of the time frame M1, the penultimate in the range of values [241, 3840], .., nth in the interval [240 * n + 1, 3600 + 240 * n ] minute chart. And, if, say, IS = 1, then the last column is calculated according to the last 240 values of the minute chart, the penultimate column is calculated according to the values of the interval [241,480], etc., with the mapping, of course, in all cases, to H4.
The program splits the total price fluctuation for a given averaging period into seven equal intervals and calculates the frequency of the price hits of historical data of already small timeframes in that intervals. From these 7 intervals for each moment of the analyzed large time frame, rectangles of the probability mapping are formed (7 rectangles for each, marked by a bar of a large time frame, time point). Calculated on the basis of the statistical frequencies of the price (small timeframes) hit in the intervals specified by the program, the probability columns can be displayed in the main terminal window in two ways:
1) in the form of a color code, the type of the spectrum of visible light, when the most probable values are closer to the violet area, and the least probable values are close to the red, with the coloring of the intervals by the corresponding colors (the order of encoding the decreasing probability by means of the color scale is specified in the settings and can there be changed at the request of the user);
2) in the form of numerical values of the probability of hit in given intervals, with the corresponding colors.
1.2. Calculation of non-lagging moving average.
The PDA indicator calculates the non-lagging moving average, which is calculated at the points (Inf, n + 1) in the usual way, and at the points of the [n, 0] segment, where 0 is the last bar number, is algorithmically and there is a curvilinear sector (cover out the confidence interval) in which the line of the non-lagging moving average fits with the confidence level specified in the indicator settings. It is clear that the more the confidence probability value is taken (which by default is equal to 0.5), the wider the curvilinear sector of the confidence interval is obtained. If we take the confidence probability equal to zero, then the sector of the indicator readings at points [n, 0] will shrink to a curve, which will pass through the most probable values of the non-lagging average. Statistical studies show that the price around the non-remaining average is distributed according to the Laplace law. Knowledge of the distribution law and the algorithm for calculating the most likely non-lagging average on the [n, 0] segment allow us to calculate the confidence interval sector.
1.3. Calculation of non-lagging asymmetry.
The PDA indicator allows you to predict the beginning of a change in the direction of trends, long before their visual manifestation on the price chart, by calculating the asymmetry that is displayed in the lower window of the indicator.
The author statistically revealed that before changing the direction of the trend, the probability distribution function of the price is made as asymmetric as possible. More precisely, the price movement in any direction always pulls sideways the function of its distribution, but when the third-degree root of asymmetry divided by the standard deviation exceeds the unit in absolute value, the price will change its direction. This function the indicator operation is based on this regularity. The indicator calculates the value of the third degree root asymmetry normalized to the standard deviation, i.e. magnitude
ASUMM= (< (x - <x>)^3 >)^(1/3)/ (< (x - <x>)^2 >)^(1/2) ,
where <...> is the averaging sign, which, when it is module exceeded the unit , serves as a powerful signal to change the direction of a previously established trend.
It has also been established that the asymmetry plot changes sign when the price probability density function makes a sharp jump, which is characteristic of price dynamics.
The sliding asymmetry counted in a particular window, as well as the variance and the moving average, lags behind by about the floor of the averaging period used. Therefore: (1) For past price values, the asymmetry plot shifts back through history by the amount of delay; (2) To receive a signal in a timely manner, a special compression algorithm for the asymmetry calculation period is applied when approaching the beginning of the current history. At the same time, to ensure the possibility of calculating such asymmetry (creating a sufficient array of calculated points) on the M5-H4 time frames, be used the data of the minute chart is M1, the daily time frame is - M5, the weekly - M30, and the monthly - H1. On M1, this indicator, respectively, is not used.
- Modes of operation of the indicator PDA.
For the convenience of reading the color-coded probability values from the indicator prob_distrib, it is desirable to make a black background on the color scheme of the main window of the MT4 terminal and display prices also with a dark line or red and green bars.
The moving average, taken with the averaging period 2*n+1 is known to lag behind the n bars; the sliding probability distribution that calculates the first mode of the PDA indicator also lags behind, which in this case represents the data in such form (Fig. 1).

Fig. 1. Mode for calculating the sliding probability distribution of prices and asymmetry IS=15.
However, since the information on the frequencies of the price hit in given intervals is obtained on the basis of a large amount of data extracted from the lower time frames, it is possible to obtain algorithmically the without delay probability distribution, the calculation of which constitutes the second mode of operation of the indicator. In this case, the previous type of distribution is shifted to bars n to the past, and information about the distribution on the n-1 bar is found on the bars 2*(n-1) +1 of a large time frame, i.e. on the points (2*(n-1) +1)*Tl/Ts, where Tl - the duration of a large time frame, Ts - the duration of a small time frame, that detailing a large, the (n-k) bar on the 2*(n-k) +1 bars of a large time frame, i.e. on (2*(n-k) +1)*Tl/Ts points, and about a zero bar on on it himself, more precisely, on an array of the prices equal quantity Tl/Ts; at the same time, the probability distribution is calculated not on a bar that may be incomplete, but on the last such number of points of a small time frame that forms a full bar, which allows obtaining distributions for individual bars (Figure 2.1).
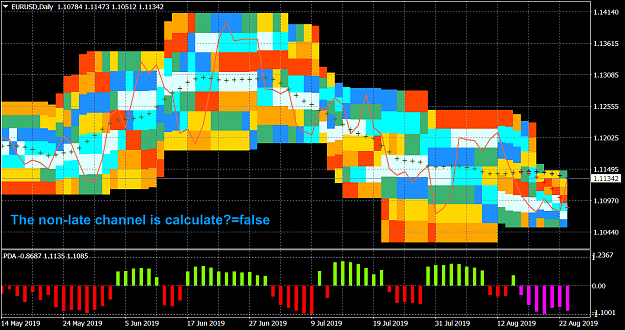
Fig. 2. The mode of calculating the without delay probability distribution IS=15.

Fig. 2.1. Probability distribution over bars IS=1.
In the third mode, the algorithm for calculating the non-lagging probability distribution is still more complicated. The current price channels corresponding to the averaging period are calculated at the end of the history. (Fig. 3).

Fig. 3. Calculation mode of non-lagging distribution and non-lagging price channels IS=15.
In all operating modes, the confidence interval of the non-lagging average can be, as well as painted over. Shading allows you to better see this interval itself, but impairs the vision of the details of the probability density distribution. Therefore, by default, the confidence interval is not painted over, but is marked only with blue (top of the interval) and red (bottom of the interval) crosses.

Fig. 3.1. Calculation mode of non-lagging distribution and non-lagging price channels. Shading the confidence interval of the non-lagging average. IS=15.

Fig. 3.2. The third mode with filling the confidence interval of the non-lagging average close-up.
In each of the above modes (1-3), the probability density mapping can be changed from its color coding (colors can be customized by the user) to the numerical presentation (Fig.4).

Fig. 4. The third mode with numerical probability mapping IS=15.
In the third mode, based on the calculated channel limits (which then need to place stops), the deposit and the specified risk level, you can also calculate the lot size for the trade within this channel, the lot information is displayed in the main window where its location is configured and can be selected, both at the bottom of the channel and at the top (Fig. 5).

Fig. 5. The third mode with the calculation of the lot.
The indicator is resource-intensive and calculates a small number of bars, but to search for possible new channels, the calculation area can be moved deep into history, for which the «Shifting the calculation area of the indicator» parameter is set in the settings.
The current mode of operation and all its characteristics are printed on the "Experts" tab of the window of the terminal MT4.

Fig. 6. Information about the indicator mode.
3. The indicator settings.
The indicator settings are shown in Fig. 7, where they are described in the terminal window “inputs”.

Fig. 7. Indicator settings.
The indicator settings are divided into:
Algorithm settings:
- The averaging period in the bars of the current graph (2n+1) - averaging period (1-99).
- Number of countable bars of the current chart (<=200) - number of calculated indicator graph bars (1-200).
- Shifting the calculation area of the indicator - global indicator shift (0-100).
- The non-lagging distribution is calculated - calculate a non-lagging distribution.
- The non-late channel is calculated - calculate the current non-lagging channel.
- Show the values of the probabilities of zones - display area probability values.
Color and display settings:
Colors in probability density descending order.
- Color of the maximum probability zone (0) =clrLightCyan;
- Color of zone (1) =clrAqua;
- Color of zone (2) =clrDodgerBlue;
- Color of the zone of average probability (3) =clrMediumSeaGreen;
- Color of zone (4) =clrGold;
- Color of zone (5=clrOrange);
- Color of the minimum probability zone (6) =clrOrangeRed;
Parameters of non-lagging moving average.
- Moving average price type - applied price. Values: Close price, Open price, High price, Low price, Median price ((high + low)/2 - default), Typical price ((high + low + close)/3), Weighted price ((high + low + 2*close)/4).
- The averaging method - averaging method. Values: Simple (default), Exponential, Smoothed, Linear weighted.
- Confidence probability - Values:from 0 to 0.999 (0.5 by default).
- Color of the moving average line=clrDarkOliveGreen; - The color of the indicator line and its figure sector.
- Paint over the confidence interval? Values: true, false (by default)
Trading mode settings:
- Calculate the lot size from the risk, deposit and channel
- Deposit in $
- Allowable losses in %
- The channel strategy is used - true - intra-channel strategy (false - channel breakthrough strategy)
- Color of message about the size of the lot
- Information about the lot at the bottom of the channel (false - information at the top of the channel)
- Identified by the PDA indicator of the laws of the market and how to use them for successful trading.
Looking at the color maps of the probability distribution, it is easy to notice that the places where the price "trampled on" the most, form on all time frames rather extensive horizontal bands (Figure 8-9), which are similar to discrete energy levels, when the price from one level to another passes jump, almost avoiding intermediate points, in which the probability density of its hit are sometimes minimal. And, if the averages move smoothly, falling into such zones of maximum probability by passing through all intermediate points (and otherwise can not be) and do not distinguish similar probability concentration bands, these zones are easily identifiable by the indicator PDA, since they really form are constant levels that are essentially discrete or torn apart from each other.


