Why trade with the eyes when the ears are 20 times faster.
Hello dear subscribers,
In the last 14 days, I initially took a few days off to prepare my next concepts in peace. We traders are like artists who sometimes need a creative break. You can recharge your batteries by the sea or in the mountains and come up with interesting ideas that you can then implement.
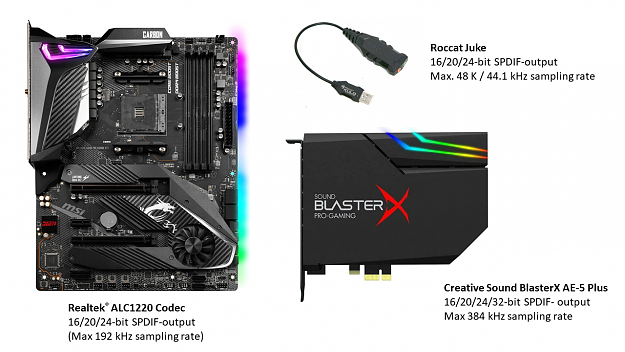
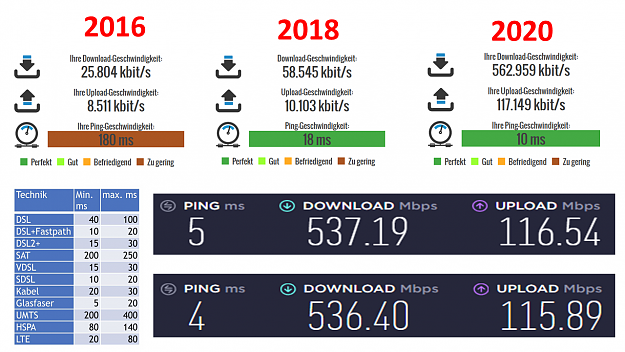
In the past few weeks, my filter settings for stock market data have increased so much that my workstation was regularly overloaded, the temperatures of the CPU rose to 75-80 ° C in some cases. The data stalled in very volatile phases, making it difficult to make a trading decision. Most exchange traders may have opened 5-10 different charts and use 1 to 5 different indicators with filter settings within these charts. That are a total of 50 different filter settings. I use up to 25 different charts, using 300 different filter settings in three different DoM views alone. Overall, I work with over 1000 filter settings. So it is clear that the performance suffers. My average CPU mark was 15,000, which was above average. But the CPU alone is not enough, it is crucial to optimally match the individual components such as CPU, mainboard, cooler, hard drives and graphics cards. I started with this, this two weeks ago.
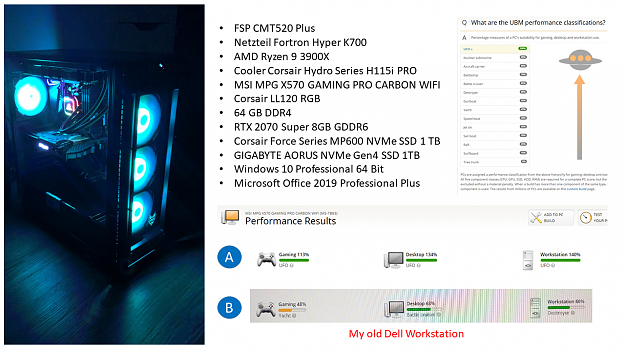
With many comparisons on the Internet and in trade magazines, I put together my first individual trading PC. This time I switched to an AMD processor because the Intel processors are getting very hot. In addition, I use a maintenance-free CPU water cooling and 6 internal fans. The graphics card is enough because I don't use video games. The hard drives are extreme with up to 5000 MB / s write speed and an access time of 0.02 seconds. The color of the fans immediately shows me the CPU temperature range. From the perspective of a computer professional, this compilation could certainly have been optimized, but I would also like to be familiar with this area to be independent. In the beginning you always make mistakes. The first benchmark test was very promising. Point A shows the results of my new workstation, Point B shows the results of my old workstation. At cpubenchmark you can test your workstation yourself for free.
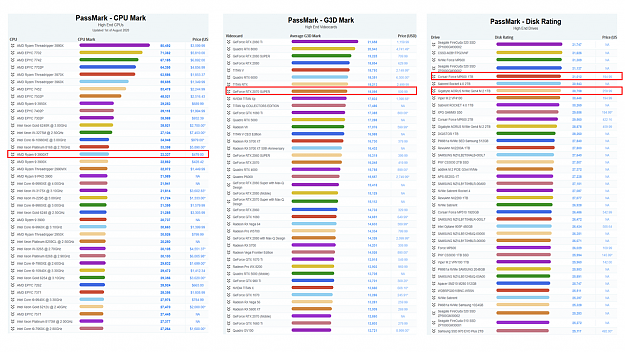
Of 750 high-end processors, I currently have the 16. fastest CPU with the best price-performance ratio. The CPU benchmark is now over 33,000, previously it was 14,000. The benchmark in the graphics card area has also improved from 10,000 to 18,000. It is extrem in the area of the hard disk. Although I had previously worked with a Samsung SSD, the value has now improved from 4000 to over 31,000. It's not about being in first place in all areas, but about achieving the best price-performance ratio. I could have bought an equivalent CPU, but it would have cost twelve times more. The RAM only plays a subordinate role with these components. If you enter Google: PassMark Cpu, you will find your personal benchmark values. By the way, this helps you to determine the best price-performance ratio if you want to buy a new computer component soon.
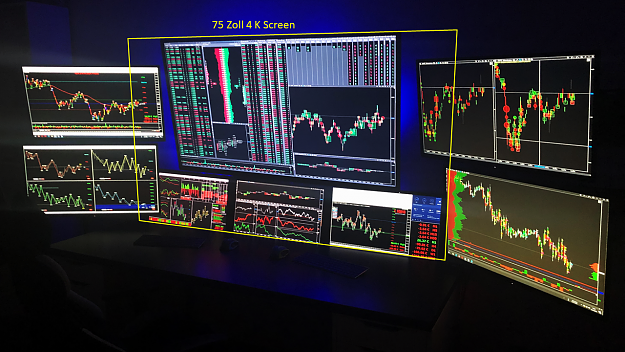
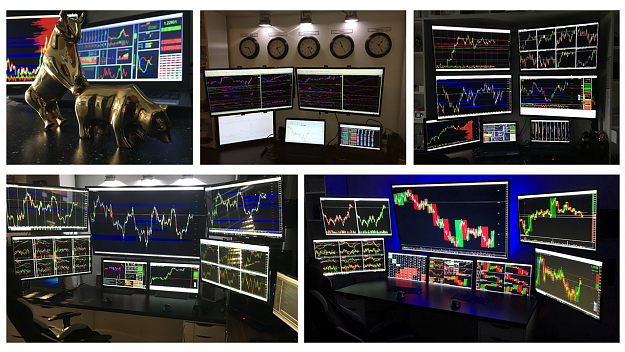
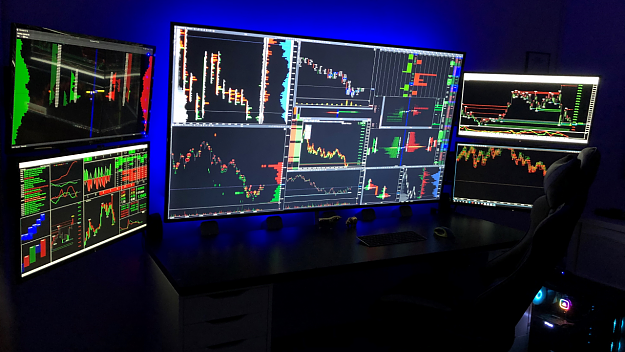
My next project will be a 75 inch 4K screen. This will then replace the 55 inch 4K and my 3 smaller screens. Five screens are a little clearer than eight screens.
Last week I started comparing my old workstation with the new workstation. I used the same filter settings in the area of my stock exchange software and was absolutely delighted with the huge difference. The speed of the new hard drives, due to the access time, can no longer be compared and I noticed temperature differences of up to 20 °. Even in extreme, volatile phases, there was no weakness with my new workstation. This motivates me to the extent that I now have great potential to drive further complex filter settings. I immediately started doing this last week and I want to show you the first result today.
On May 23, 2020, I posted a crucial contribution that, in my view, was not noticed enough. Those of you who haven't read this post can do so here. The decisive part begins according from slide no.2.
Fast and furious
The identification of bid and ask via tones beat our sense of sight by a long way. With this I question a trading decision based on our eyes. Let's take a closer look at that.
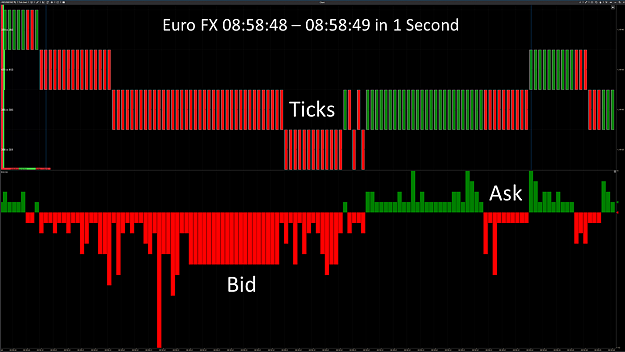
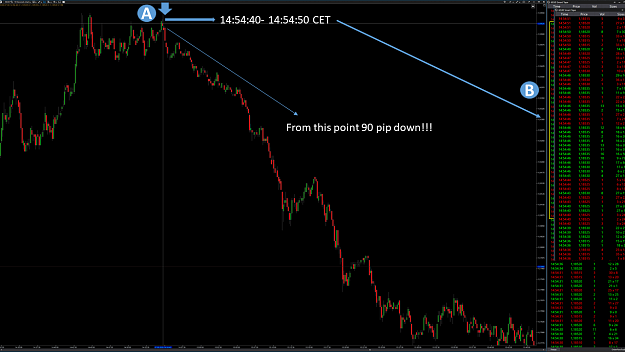
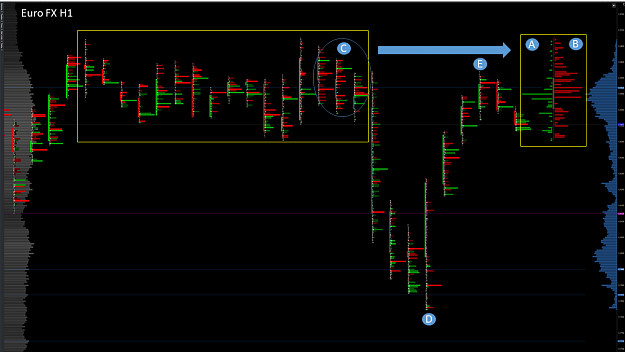
Last Friday, 264 lots with 108 ticks (trading transactions) entered the market in the Euro FX within 1 second (from 08:58:48 - 08:58:49 CET). In the chart you can see the individual trading transactions and, below, a breakdown of how much bid and ask were contained in this trading transaction. Please note that this representation is 1 second.
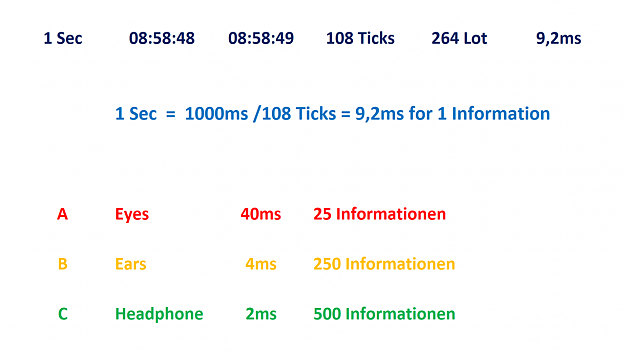
Let's look at an evaluation. If 108 trades enter the market within 1 second, it means that you have 9.2 milliseconds to identify a trade. With our eyes, however, we need at least 40 ms to record information. This means that out of the 108 trades, we can effectively only identify 25 trades. With special tones coming from a loudspeaker, we would be able to identify 250 different pieces of information. With headphones and special sound programming, this value could double once again.
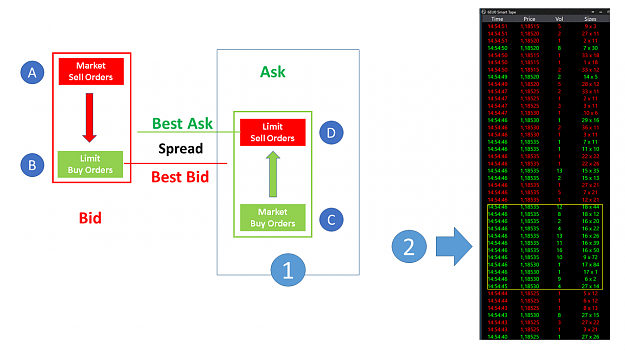
Point A
Here we see my time and sales list, which only shows the market sell orders that are known to run in the limit buy orders. The blue fields show when an equilibrium arises in the area of the sizes.
Point B
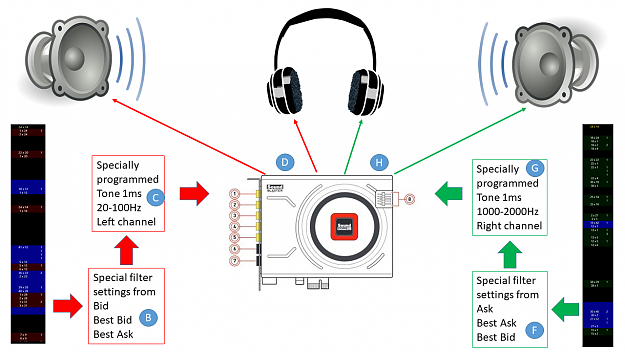
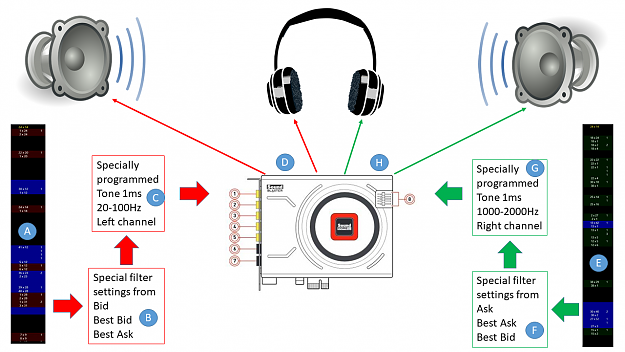
With a special filtering of bid, best bid and best ask, this information is passed on to a specially programmed tone.
Point C
This special programmed tone has the property of being completed within 1 ms. However, human hearing is only able to perceive different tones from 2 ms. In order to have some air and to ensure optimal perception, I will program the sound in the 1ms range. I chose a frequency range of 20-100 Hz, which corresponds to a lower tone, similar to a bass. I assigned this sound to the left speaker channel.
Point D
From there, this sound must be sent to a high-quality, external or internal sound card, since the sound card on the mainboard is usually not able to transmit these 1 ms tones to the speakers properly.
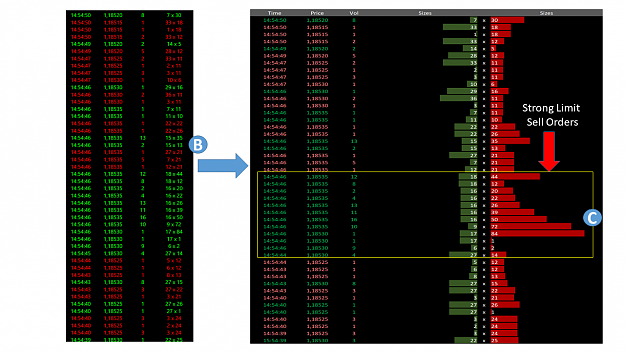
Point E
Here we see a time and sales list that only shows the market buy orders that are known to run in the limit sell orders. The blue fields show when an equilibrium arises in the area of the sizes.
Point F
With a special filtering of Ask, Best Ask and Best Bid, this information is passed on to a specially programmed tone.
Point G
This special programmed tone has the property of being completed within 1 ms. I chose a frequency range of 1000-2000Hz. that of a higher note is similar to the treble. I assigned this sound to the right speaker channel.
Point H
From there, this sound must be sent to a high-quality, external or internal sound card, since the sound card on the mainboard is usually not able to transmit these 1 ms tones to the speakers properly.
As we know, the human brain is divided into an analytical, logical left brain and an emotional, creative right brain. Basically there are asymmetries in this area, not both hemispheres of the brain are responsible for everything equally. We should take a closer look at these factors later, but first I did the sound distribution as follows.We hear the different ask tones (course wants to go up) with our right ear and the different bid tones (course wants to go down) with our left ear. Now let's take a look at how this works in practice.
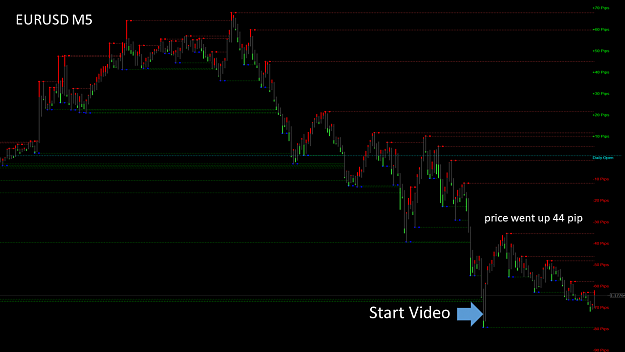
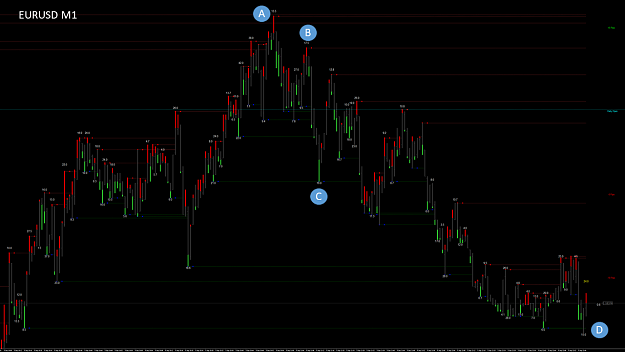
So that we first know where we are, you can see where the video starts with the blue arrow. The chart is in EURUSD from the last trading day on Friday.
Here you can see my filtered stock market data, which I do not want to go into in detail now. For better orientation I have shown you an M1 from the Forex Chart (Point A). If you now watch the video you will notice that my special filtered bid tones come in on the left speaker side and my specially filtered ask tones come in on the right speaker side. You can literally notice how the price is pushed up and some institutional traders try to push the price down again. Ultimately, buyers win because the price then went up 44 pip.
The tones that I have programmed here are only a rough draft and will be of course yet significantly optimized. Likewise, they are clearly too slow with about 3ms, but they are enough to understand the principle. To make a comparison, three known Windows tones have the following tone times: Windows note tone: 1350ms, Windows Ping: 1100ms and Chord: 650ms. The sounds you heard in the video were 200 times faster than the fastest Windows sound. These are worlds in trading. Maybe you noticed something in the video. There are significantly more tones coming in than there are bid and ask orders. This is because the penetration of the sizes (Best Bid and Best Ask) are included. I also included the strength of the limit sell and limit buy orders. This results in clear pattern sequences that appear again and again at regular intervals. And it is precisely these aspects that you can never grasp with your eyes.
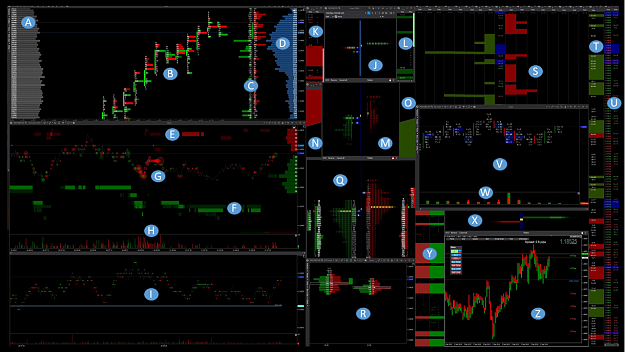
The stock exchange software I work with is optimal for my special needs. There is no comparable software worldwide that has such filter settings. The complex stock market data require high computer performance, which is why this software has been completely re-programmed with a new architecture. Part of the required performance is outsourced to the GPU so that the CPU is used less. The speed increase is enormous and helps me with these complex filter settings. In principle, my filter settings are comparable to programming an indicator. In theory, anyone who works with the same software could use it. But without concrete background knowledge it doesn't make sense.
Over the past few months, I have noticed that there are clear patterns in my programmed DoM views that can be seen in the video that keep reappearing in certain situations. This is because the big players work with algorithms that always work the same way. The advantage of the algorithms is that they can submit trading orders significantly faster than a human being would be able to do. The disadvantage is that there are always the same patterns that can be read and recognized with the appropriate software. The same also applies to the tones. Everyone knows the situation when a course goes down and you wonder when the course will go up again. Interestingly, I am already able to tell when it is time from the tones and pattern sequences in the DoM. Of course, that doesn't always work, since I've only just started to analyze the different patterns.
Traders have been looking for specific patterns for many years and have so far been unsuccessful. This is because there are no patterns in the price trend, volume, bid and ask in the footprint charts or in the indicators. Anyone who knows a little about programming algorithms knows that they always react the same way in certain situations. This is exactly the guarantee that there are certain pattern sequences right there that you only have to clearly and infect. The trick is to use a certain filter setting to highlight the crucial things. Decoding the code will take a while, but I'm already on the trail of the big players. The only chance for clear pattern recognition lies solely in the algorithms, everyone should be aware of what this could mean in the long term. Next week I will look at the tones in more detail. The timbre is crucial for quick identification. The speed should be less than 1ms and control the correct channel. My first goal is to program two different tones on the right and left speaker channels. It is theoretically possible to measure the strength of the market orders and the limit orders. Let's see how far I get. As always, it remains exciting.
I wish you a nice weekend and a successful start next week.
Best regards Michael
Hello dear subscribers,
In the last 14 days, I initially took a few days off to prepare my next concepts in peace. We traders are like artists who sometimes need a creative break. You can recharge your batteries by the sea or in the mountains and come up with interesting ideas that you can then implement.
In the past few weeks, my filter settings for stock market data have increased so much that my workstation was regularly overloaded, the temperatures of the CPU rose to 75-80 ° C in some cases. The data stalled in very volatile phases, making it difficult to make a trading decision. Most exchange traders may have opened 5-10 different charts and use 1 to 5 different indicators with filter settings within these charts. That are a total of 50 different filter settings. I use up to 25 different charts, using 300 different filter settings in three different DoM views alone. Overall, I work with over 1000 filter settings. So it is clear that the performance suffers. My average CPU mark was 15,000, which was above average. But the CPU alone is not enough, it is crucial to optimally match the individual components such as CPU, mainboard, cooler, hard drives and graphics cards. I started with this, this two weeks ago.
Attached Image (click to enlarge)
With many comparisons on the Internet and in trade magazines, I put together my first individual trading PC. This time I switched to an AMD processor because the Intel processors are getting very hot. In addition, I use a maintenance-free CPU water cooling and 6 internal fans. The graphics card is enough because I don't use video games. The hard drives are extreme with up to 5000 MB / s write speed and an access time of 0.02 seconds. The color of the fans immediately shows me the CPU temperature range. From the perspective of a computer professional, this compilation could certainly have been optimized, but I would also like to be familiar with this area to be independent. In the beginning you always make mistakes. The first benchmark test was very promising. Point A shows the results of my new workstation, Point B shows the results of my old workstation. At cpubenchmark you can test your workstation yourself for free.
Attached Image (click to enlarge)
Of 750 high-end processors, I currently have the 16. fastest CPU with the best price-performance ratio. The CPU benchmark is now over 33,000, previously it was 14,000. The benchmark in the graphics card area has also improved from 10,000 to 18,000. It is extrem in the area of the hard disk. Although I had previously worked with a Samsung SSD, the value has now improved from 4000 to over 31,000. It's not about being in first place in all areas, but about achieving the best price-performance ratio. I could have bought an equivalent CPU, but it would have cost twelve times more. The RAM only plays a subordinate role with these components. If you enter Google: PassMark Cpu, you will find your personal benchmark values. By the way, this helps you to determine the best price-performance ratio if you want to buy a new computer component soon.
Attached Image (click to enlarge)
My next project will be a 75 inch 4K screen. This will then replace the 55 inch 4K and my 3 smaller screens. Five screens are a little clearer than eight screens.
Last week I started comparing my old workstation with the new workstation. I used the same filter settings in the area of my stock exchange software and was absolutely delighted with the huge difference. The speed of the new hard drives, due to the access time, can no longer be compared and I noticed temperature differences of up to 20 °. Even in extreme, volatile phases, there was no weakness with my new workstation. This motivates me to the extent that I now have great potential to drive further complex filter settings. I immediately started doing this last week and I want to show you the first result today.
On May 23, 2020, I posted a crucial contribution that, in my view, was not noticed enough. Those of you who haven't read this post can do so here. The decisive part begins according from slide no.2.
Fast and furious
The identification of bid and ask via tones beat our sense of sight by a long way. With this I question a trading decision based on our eyes. Let's take a closer look at that.
Attached Image (click to enlarge)
Last Friday, 264 lots with 108 ticks (trading transactions) entered the market in the Euro FX within 1 second (from 08:58:48 - 08:58:49 CET). In the chart you can see the individual trading transactions and, below, a breakdown of how much bid and ask were contained in this trading transaction. Please note that this representation is 1 second.
Attached Image (click to enlarge)
Let's look at an evaluation. If 108 trades enter the market within 1 second, it means that you have 9.2 milliseconds to identify a trade. With our eyes, however, we need at least 40 ms to record information. This means that out of the 108 trades, we can effectively only identify 25 trades. With special tones coming from a loudspeaker, we would be able to identify 250 different pieces of information. With headphones and special sound programming, this value could double once again.
Attached Image (click to enlarge)
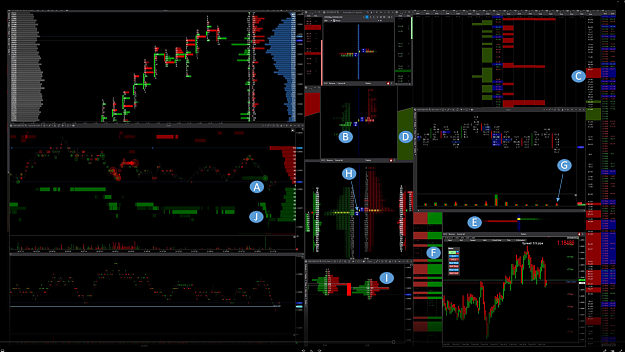
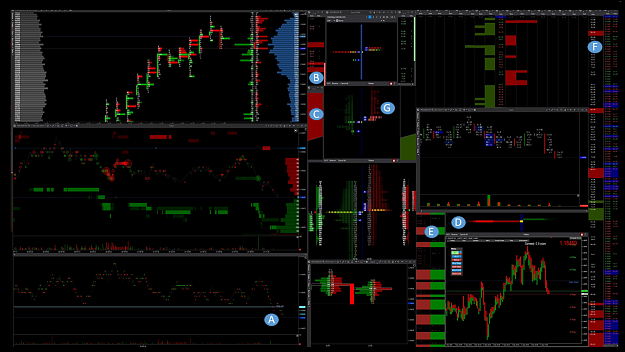
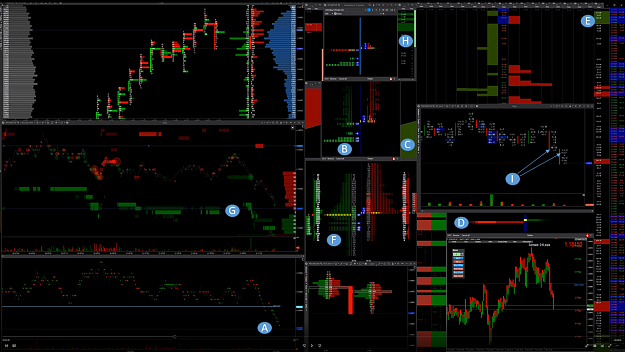
Point A
Here we see my time and sales list, which only shows the market sell orders that are known to run in the limit buy orders. The blue fields show when an equilibrium arises in the area of the sizes.
Point B
With a special filtering of bid, best bid and best ask, this information is passed on to a specially programmed tone.
Point C
This special programmed tone has the property of being completed within 1 ms. However, human hearing is only able to perceive different tones from 2 ms. In order to have some air and to ensure optimal perception, I will program the sound in the 1ms range. I chose a frequency range of 20-100 Hz, which corresponds to a lower tone, similar to a bass. I assigned this sound to the left speaker channel.
Point D
From there, this sound must be sent to a high-quality, external or internal sound card, since the sound card on the mainboard is usually not able to transmit these 1 ms tones to the speakers properly.
Point E
Here we see a time and sales list that only shows the market buy orders that are known to run in the limit sell orders. The blue fields show when an equilibrium arises in the area of the sizes.
Point F
With a special filtering of Ask, Best Ask and Best Bid, this information is passed on to a specially programmed tone.
Point G
This special programmed tone has the property of being completed within 1 ms. I chose a frequency range of 1000-2000Hz. that of a higher note is similar to the treble. I assigned this sound to the right speaker channel.
Point H
From there, this sound must be sent to a high-quality, external or internal sound card, since the sound card on the mainboard is usually not able to transmit these 1 ms tones to the speakers properly.
As we know, the human brain is divided into an analytical, logical left brain and an emotional, creative right brain. Basically there are asymmetries in this area, not both hemispheres of the brain are responsible for everything equally. We should take a closer look at these factors later, but first I did the sound distribution as follows.We hear the different ask tones (course wants to go up) with our right ear and the different bid tones (course wants to go down) with our left ear. Now let's take a look at how this works in practice.
Attached Image (click to enlarge)
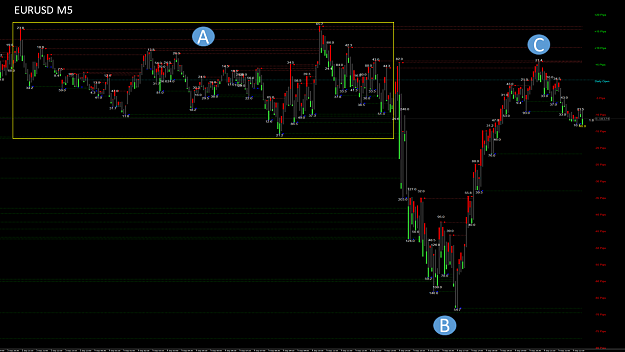
So that we first know where we are, you can see where the video starts with the blue arrow. The chart is in EURUSD from the last trading day on Friday.
Attached Image (click to enlarge)
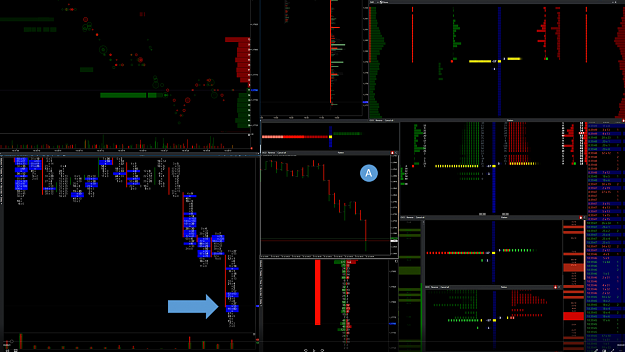
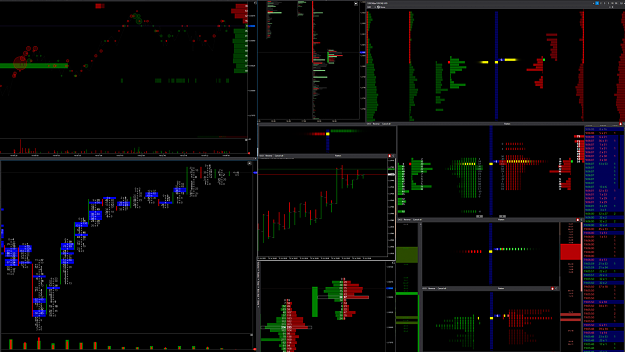
Here you can see my filtered stock market data, which I do not want to go into in detail now. For better orientation I have shown you an M1 from the Forex Chart (Point A). If you now watch the video you will notice that my special filtered bid tones come in on the left speaker side and my specially filtered ask tones come in on the right speaker side. You can literally notice how the price is pushed up and some institutional traders try to push the price down again. Ultimately, buyers win because the price then went up 44 pip.
Inserted Video
The tones that I have programmed here are only a rough draft and will be of course yet significantly optimized. Likewise, they are clearly too slow with about 3ms, but they are enough to understand the principle. To make a comparison, three known Windows tones have the following tone times: Windows note tone: 1350ms, Windows Ping: 1100ms and Chord: 650ms. The sounds you heard in the video were 200 times faster than the fastest Windows sound. These are worlds in trading. Maybe you noticed something in the video. There are significantly more tones coming in than there are bid and ask orders. This is because the penetration of the sizes (Best Bid and Best Ask) are included. I also included the strength of the limit sell and limit buy orders. This results in clear pattern sequences that appear again and again at regular intervals. And it is precisely these aspects that you can never grasp with your eyes.
Attached Image (click to enlarge)
The stock exchange software I work with is optimal for my special needs. There is no comparable software worldwide that has such filter settings. The complex stock market data require high computer performance, which is why this software has been completely re-programmed with a new architecture. Part of the required performance is outsourced to the GPU so that the CPU is used less. The speed increase is enormous and helps me with these complex filter settings. In principle, my filter settings are comparable to programming an indicator. In theory, anyone who works with the same software could use it. But without concrete background knowledge it doesn't make sense.
Over the past few months, I have noticed that there are clear patterns in my programmed DoM views that can be seen in the video that keep reappearing in certain situations. This is because the big players work with algorithms that always work the same way. The advantage of the algorithms is that they can submit trading orders significantly faster than a human being would be able to do. The disadvantage is that there are always the same patterns that can be read and recognized with the appropriate software. The same also applies to the tones. Everyone knows the situation when a course goes down and you wonder when the course will go up again. Interestingly, I am already able to tell when it is time from the tones and pattern sequences in the DoM. Of course, that doesn't always work, since I've only just started to analyze the different patterns.
Traders have been looking for specific patterns for many years and have so far been unsuccessful. This is because there are no patterns in the price trend, volume, bid and ask in the footprint charts or in the indicators. Anyone who knows a little about programming algorithms knows that they always react the same way in certain situations. This is exactly the guarantee that there are certain pattern sequences right there that you only have to clearly and infect. The trick is to use a certain filter setting to highlight the crucial things. Decoding the code will take a while, but I'm already on the trail of the big players. The only chance for clear pattern recognition lies solely in the algorithms, everyone should be aware of what this could mean in the long term. Next week I will look at the tones in more detail. The timbre is crucial for quick identification. The speed should be less than 1ms and control the correct channel. My first goal is to program two different tones on the right and left speaker channels. It is theoretically possible to measure the strength of the market orders and the limit orders. Let's see how far I get. As always, it remains exciting.
I wish you a nice weekend and a successful start next week.
Best regards Michael
Forget:That does not work, amateurs build the ark, pros the Titanic!
12