looks like that's the end of our Friday night journey.
I would like to take this time to thank Alan - who IMO is by far and large the most generous and knowledgeable trader by a long shot on this forum, and to anyone who doubts the validity of this system, you can see, right here and now, if you open our eyes, in real-time, that profitable trade can be taken, on the EMA swings
life is a reflection of what we allow ourselves to see
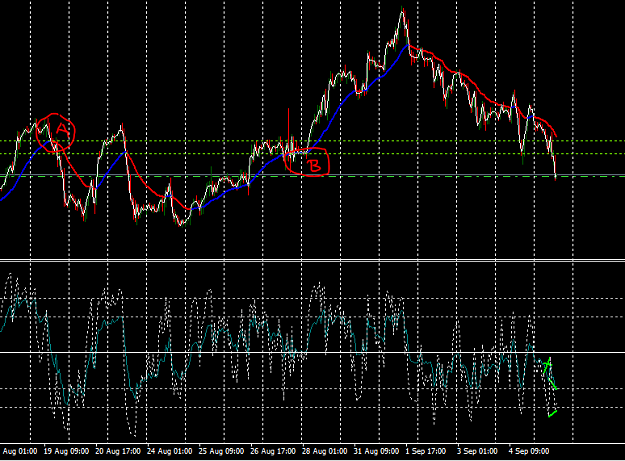
Hi Guys, Can you advice if average is heading to swing at A or B? {image}
Ignored
Hi 4xscholar
B is the next swing target (at least to the downside)
Swing point A has already been reached by the MA (just to the right of swing B) so it’s no longer valid as a target
cheers
Hi Guys, Can you advice if average is heading to swing at A or B? {image}
Ignored
If in your example the average has failed to make the next LL then it turns to test the next HH your B. If this be the case then we expect price to make the following average HH which is A. Note how the price stalled for a while at A to allow the EMA to catch up, some refer to this as consolidation (I do not) I prefer to call it a holding pattern.
Now the average tries for A so price will try for the next average swing high. You may expect to see continuation divs at this time sending the price higher.
Once the price has reached these next levels we expect to see a bear div to change the direction and halt or turn the EMA south again. Finding bear support the object now is for the average to make the LL so price has to run to the next LL level at 3196 and we should be seeing continuation divs sending it down there.
Once reached we should see a bull div to turn it back north again and soo the story goes as price attempts to test each side.
The most recent swing(Low to downside/High to upside) is the target of the average. If these are taken out, the next in line going back is the target. In my example, when the swing between A&B was taken out by B, A became the next target.
Here is a solution for the Humps MA indicator. I asked my coder to change the code so we have the horizontal line split into two phases. The first phase is until price cuts the line. The second phase is when the EMA cuts the line. To put that in just one indicator was more work than my coder wanted to spend on it. But there is a workaround. If we put two instances of the indicator on the chart with different settings, then both lines are plotted on top of each other. That means the first phase should be a solid line and the second phase can be dashed...
{quote} I have drawn red trend lines on the RSI and Price. On the price, the C point is attacking the A point. On the RSI the red line is drawn across the 14 period RSI from bottom to top. It must not cut into any peaks as you have done. We are not looking at the 5 RSI in this instance. Hope it helps {image}
Ignored
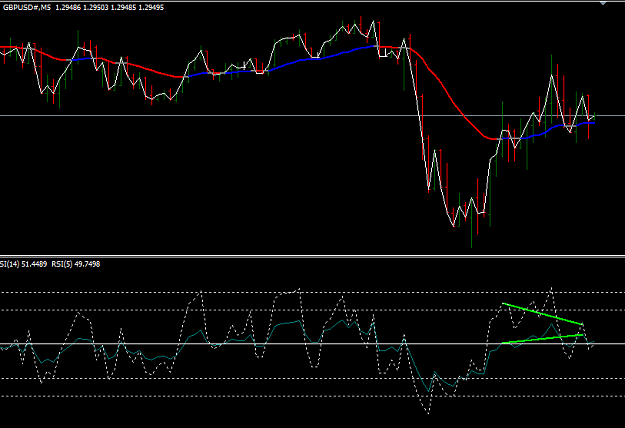
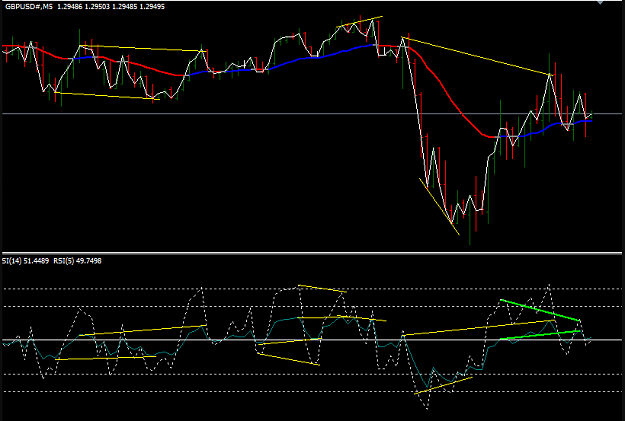
I have been trying to find out from within the thread what the rules are regarding drawing trend lines in the RSI and the above post is what I found. I have attached a picture of today's M5 and want to ascertain that the rsi-div drawn is not allowed?
{quote} I have been trying to find out from within the thread what the rules are regarding drawing trend lines in the RSI and the above post is what I found. I have attached a picture of today's M5 and want to ascertain that the rsi-div drawn is not allowed? {image}
Ignored
Your lines are completely wrong... We cannot just chop through the data to make lines fit.
There are many instances of div both regular and RSI on your chart you have missed off.
Reading from left to right we have
1) A regular Bull div
2( A regular Bear div
3( Ab RSI bull div
4) An RSI Bear div
5) A regular bear div
6) A regular Bull div
7) A regular Bear div
The two lines I had drawn were intentional to make sure that I understood the post I quoted in my question. I remember in one of the post you mentioned "we cannot make lines fit", but that post was related to AB=CD targets.
The rest of the Divs on the chart I had found and traded.
Thank you again for taking time to answer to the questions
I have question for you. It has to do with divergence being skipped over by the price and market.
Now to confirm we need divergence then we need prices to cross ema and see support then we know ema will try and reach the hh/ll. Sometimes it fails which it does the vice versa and goes the opposite way to catch the ll/hh
Usually when ema is going for a target we can sometimes get the good old abcd, ab=cd etc patterns we can use as targets. It explains why sometimes a divergence happens and price keeps going on its way,
My question is, is there anyway to spot a divergence failing and the trend to continue or vice versa when it is far from the ema lines , when there isn't a target in terms of pattern. Now I know we expect ema to do the hh and ll. However the issue I have it after it reaches the target level and turns most times I close my trades and end up hedging. What happens is sometimes i loose out. It can eat in to my profits. I see the price continuing on its way trying the new hh/ll. Now when this happens near the ema line i know it can be a continuation but i am not worried as i have my tight stop loss just above ema if it goes the opposite way on a cont trend.
I think my mechanics is wrong somewhere for these scenarios. I just ' don't if it is the way I manage the trade and hedge.
Now this is only during when something is coming to an end in a trend/shifting course. As we should all start our entries mainly at ema after we have checked the higher tf.
Hi Alan, I have question for you. My question is, is there anyway to spot a divergence failing and the trend to continue or vice versa when it is far from the ema lines , when there isn't a target in terms of pattern. Now I know we expect ema to do the hh and ll. However the issue I have it after it reaches the target level and turns most times I close my trades and end up hedging.
Ignored
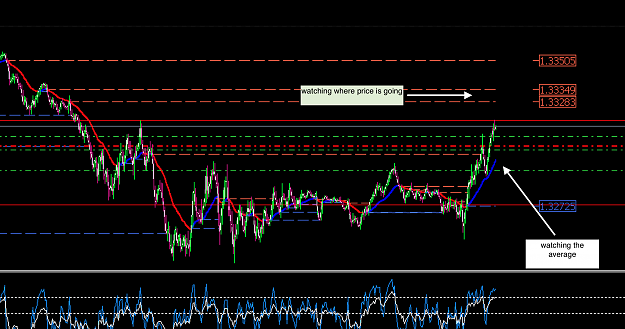
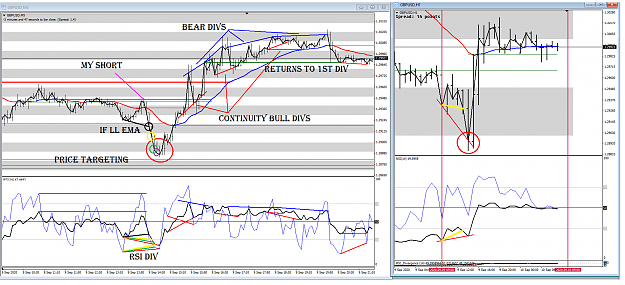
Let's take yesterdays example. The 1 hour provided us with a regular bull div, a Zoo point to consider. We drop to the 5 min and we see an RSI div with the RSI indicating exhaustion being so low down so we take this as our primary long trade.
Our hope at this time is that price will cross the 5 min EMA and the bulls will find support, which did happen.
Our next question is where is price going. The div on the hour should return the price to the EMA at least so are there enough pips in this to make our profit target with the lot size we have placed. If yes then there is little else to do but wait. If no then we may need to increase our long lots so we look for the pull backs and add accordingly. Sure we would expect bear divs on the way up but these are our heads up another long entry is due so we make plans for it as far as adjusting our lot size to reach our profit target. If we hedge with a short we may gain a few pips to deduct from our profit target or we can just risk it by ignoring the bear div. We have many options depending on how our trade is going for us in terms of the placement of entries.
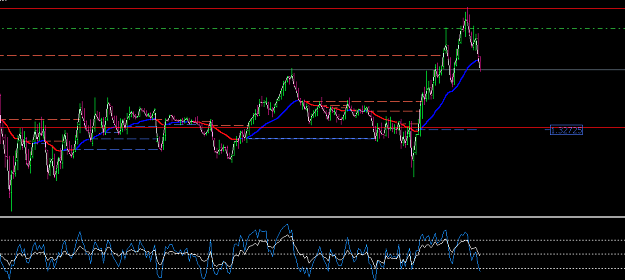
My target is 25 pips so from the primary entry to the 5 min EMA I would be done and dusted for the day about 30 mins in time.
Actually though I was done and dusted long before this on the journey down. On the 5 min chart you see my entry where I plot that if the EMA makes a LL then price targets the next level some 60 pips or so... I only want 25 so a good chance I will get paid.
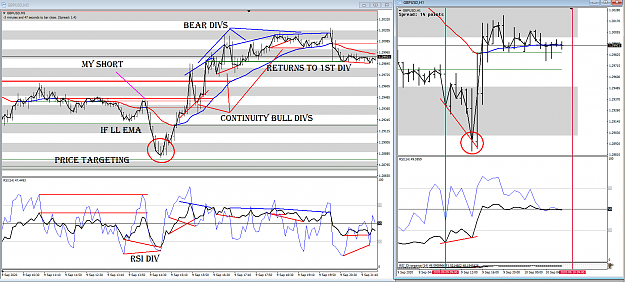
Hi Alan, my biggest problem is that it rarely seems to be the first divergence signal that is successful and I end up getting chopped up before the inevitable one that works out. In the last example, there was an unsuccessful bull div (marked in yellow) prior to the successful one that you marked in the 1 hour chart.
-Why was the bull div marked in yellow not taken?
-If taken, and we zoom into 5 min chart, given there is very often more than just one divergence signal (as there was), how many attempts in the 5 min chart do we attempt from that one 1 hour divergence signal before we give up and accept that it is failed?
-Again, say we took the first bull div which failed, given we are below the 1 hour ema, do we attempt another bull div on next candle? How many counter trend divs should we attempt?
The same questions apply to the successful 1 hour bull div. Once zoomed in to the 5 min chart, there were four bull divs that were not taken prior to the successful one and not sure why? I took the bull div in yellow and not sure what the right action is to take after it failed with a 10 pip SL. Do I just keep taking all bull divs as price moves down? I'm not sure how else I would end up being able to take the bull div signal you marked up in any other way. Appreciate any feedback as always. Attachment g
Hi Alan, my biggest problem is that it rarely seems to be the first divergence signal that is successful and I end up getting chopped up before the inevitable one that works out. In the last example, there was an unsuccessful bull div (marked in yellow) prior to the successful one that you marked in the 1 hour chart. -Why was the bull div marked in yellow not taken? -If taken, and we zoom into 5 min chart, given there is very often more than just one divergence signal (as there was), how many attempts in the 5 min chart do we attempt from that one...
Ignored
Well there are several things here we should be looking at.
1) Was the 5 min div at a 1 hour ZOO point.
2) Was a two bar test applied for the 5 min div entry.
Just these two things thin out the div entries.
Then it becomes a question of money management in that the 1st entry is a small testing the waters entry. Then as the trade progresses we add to this winning position on subsequent signals so that our winners are far greater than our losers. A ten pip loss with a small test entry should not be of any worries at all.