{quote} Very good summary and conclusion. I agree, except for: {quote} I use some indicators that help me to get a picture of the situation. Indicators that work on different time frames and that I understand! I do not follow any "arrow up=buy" or "sell alert!". But it took me a loooooong time to find the indicators that suits my trading style. Same with expert advisors: I do not let my advisors run totally without control (anymore). Not anymore, because of some situation that suddenly appeared and blew my account. Not only once... I then started...
Ignored
As long as it works for you. Indicators are not bad it's just not my thing. I just prefer price action because of demand and supply laws and all that.
{quote} there are successful traders/investors using Kelly. what would you say is better way to manage risk? arbitrary %?
Ignored
I blocked this guy. He clearly is just a Numpty. Let me be perfectly clear. All institutions use the kelly criterion. It is so important it is programmed directly into their platforms.
You are doing well but please keep in mind the levels are not support and resistance. Trying to use them as such might work for a while but eventually, you will get burned badly.
The levels are just a frame to give you the context of "possibilities" vs "probabilities".
|
Membership Revoked
|
Joined Jun 2011
|9,885 Posts
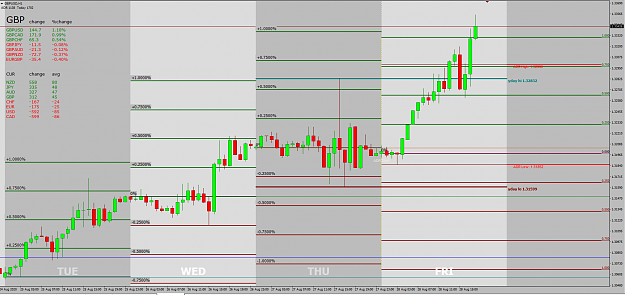
Look at this H1 chart that fallinforex posted.
This should be triggering in your mind what you can do to develop a strategy.
Look at a day on that chart.
Check to see if price closed above 0.25%. If yes, did it reach 0.5% sometime after that and before the close of the day?
Make a count of the number of days that the H1 closes a bar above 0.25% and also a count for the days where price also reached 0.5% before the day closed.
After you have at least 100 days, you will have a reasonable indication of the probability of a winning trade if you simply put a pending order slightly above 0.25% with TP just below 0.5%. Note this does not look at drawdown or SL placement at this stage.
So, you would be wise to also do a similar study to determine the probability of price going a certain amount against you after the H1 closed above 0.25% BEFORE it reaches TP so you can have statistics help you place a SL and to give some statistics about how deep the drawdowns go.
You are doing well but please keep in mind the levels are not support and resistance. Trying to use them as such might work for a while but eventually, you will get burned badly. The levels are just a frame to give you the context of "possibilities" vs "probabilities".
Ignored
Very true. I absolutely don't rely on support and resistance only. And I use very close stop loss. Plus it's important to understand the whole market. For example USD has been dropping...good profit if you bought xauusd yesterday. Canadian dollar has been doing well also for a while now. Plus I use other technical analysis which is really what my strategy is built around. The rest is just understanding the market to better my chances.
Trying to learn Gann theory. He was a genius. I think that would even further improve anyone's chances.
{quote} Very true. I absolutely don't rely on support and resistance only. And I use very close stop loss. Plus it's important to understand the whole market. For example USD has been dropping...good profit if you bought xauusd yesterday. Canadian dollar has been doing well also for a while now. Plus I use other technical analysis which is really what my strategy is built around. The rest is just understanding the market to better my chances. Trying to learn Gann theory. He was a genius. I think that would even further improve anyone's chances....
Ignored
Be sure that you understand how to construct the square of 9 and how to apply values to a chart!
Also, check on the instrument that you trade the number of pips in 45 degrees of movement, then divide by 4 and get the typical swing length before a correction is seen.
Also, do not get confused by "squaring price and time" as meaning to mathematically calculate the square. Many people try to do that. It has nothing to do with such a calculation.
{quote} Be sure that you understand how to construct the square of 9 and how to apply values to a chart! Also, check on the instrument that you trade the number of pips in 45 degrees of movement, then divide by 4 and get the typical swing length before a correction is seen. Also, do not get confused by "squaring price and time" as meaning to mathematically calculate the square. Many people try to do that. It has nothing to do with such a calculation.
Ignored
Wow thanks man...Will keep that in mind. I haven't really started yet.
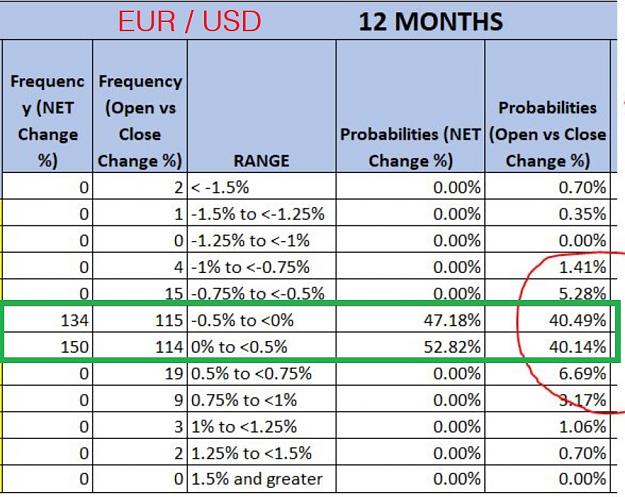
I am sure it is something I am looking at incorrectly, but from what I see, the data for the E/U is only 80.63% within 0.50% to -.50%, and the data for A/U is only 65.85% within 0.50% to - .50% levels (open to close). Please see your spread sheets attached, specifically the green boxes I added. What am I interpreting wrong, no way this has been missed this whole thread, has it?
This is what I got. Also did some smaller sample sizes (over a couple random months) and some went pretty low - in the 65% area. As far as I can tell, the statistics don't show 85%, over multiple years seems like 77% would be the more accurate figure, or am I missing something? Cheers
$300K Loss I couldn't do it, I'd probably never trade again. Then again you must have deep pockets to lose that much. I'm pleased you are turning it around. Point 2, Agreed Demo trading successfully for 5 months is a real test, I wish I only demo traded until I was successful. In day trading X5 your account isn't anything special, so many people x2-x4 their demo and start Live trading, but newbies don't know that's not enough. Once you have X50-X100 on Demo you may have the skills to do it live. Also any new setups or ideas need to be executed on...
This is what I got. Also did some smaller sample sizes (over a couple random months) and some went pretty low - in the 65% area. As far as I can tell, the statistics don't show 85%, over multiple years seems like 77% would be the more accurate figure, or am I missing something? Cheers {image}
Ignored
Well, when you take a small sample size, the smaller you go, the larger the expected deviations can be. I think CeeSo did mention the levy flights, where your distribution of data can have small bouts of large movement here and there. However over a large enough span, they all normalize.
Hence, your EURUSD data for 0.5 to -0.5 shows 77% probability over 2016-2020. It might not be 85%, but debating whether it's 80% or 85% or 77% seems to be missing the reason Ceeso brings up the percentages, in my opinion.
{quote} Well, when you take a small sample size, the smaller you go, the larger the expected deviations can be.
Ignored
Completely wrong. You cannot know what the deviation/dispersion is in advance. Similarly, when taking samples, the expectation is that the variance is the same as the population variance, within the limits. Go study Analysis of Variance (ANOVA) and how it is used in a variety of contexts.
You should also study Analysis of means. But ANOVA tends to be more robust because the distribution curve of Variances of the samples from the same population is entirely different from the distribution curve of the means of the samples.
I think CeeSo did mention the levy flights, where your distribution of data can have small bouts of large movement here and there. However over a large enough span, they all normalize.
Ignored
No, they do not normalize. You mean something else.
Hence, your EURUSD data for 0.5 to -0.5 shows 77% probability over 2016-2020. It might not be 85%, but debating whether it's 80% or 85% or 77% seems to be missing the reason Ceeso brings up the percentages, in my opinion.
Ignored
I posted earlier that after you collect your larger dataset that it would be useful to split it into groups and run statistical tests to determine if any group does not belong. Likewise, as more data are collected, you can take this new data and test statistically if it belongs to the prior data. If not, that is a signal that a significant change has occurred and your model may no longer be valid.
This is what I got. Also did some smaller sample sizes (over a couple random months) and some went pretty low - in the 65% area. As far as I can tell, the statistics don't show 85%, over multiple years seems like 77% would be the more accurate figure, or am I missing something? Cheers {image}
Ignored
I think your numbers are correct, but you're only verifying if the price closes within +0.5 -0.5%
now if you check if the price went above +0.5 then closed under +0.5, then the stats are not the same. I got around 30% hitrate then. Meaning you would be better off trading a breakout than a reversal. I think this whole thread is based on bogus statistics
here is my code:
Inserted Code
double top = o0 + percentage * o0 / 100.0;
double bot = o0 - percentage * o0 / 100.0;

if ((c0 <= top && high0 > top) || (c0 >= bot && low0 < bot))
{
  proba++;
  trades++;
}
else
  trades++;

Print("proba closes between top and bot = ",proba*100/double(trades));
and if you use smaller numbers than 0.5 (like 0.1), then the hitrate goes up obvisouly (around 70%), but profit is then smaller (too small)...so that's, not a solution either
{quote} I think your numbers are correct, but you're only veryfying is the price closes within +0.5 -0.5% now if you check if the price went above +0.5 then closed under +0.5, then the stats are not the same. I got around 30% hitrate then. Meaning you would be better off trading a breakout than a reversal. I think this whole thread is based on bogus statistics here is my code: double top = o0 + percentage * o0 / 100.0; double bot = o0 - percentage * o0 / 100.0; if ((c0 <= top && high0 > top) || (c0 >= bot && low0 < bot)) { proba++; trades++;...
Ignored
You think wrong. The statistics are not bogus. However, how they are being (mis)used in most of the postings and by many people that clearly know very little about the subject, which can certainly make it appear that the statistics are a problem when in reality, it is the presenter that is the problem.
{quote} I think your numbers are correct, but you're only veryfying is the price closes within +0.5 -0.5% now if you check if the price went above +0.5 then closed under +0.5, then the stats are not the same. I got around 30% hitrate then. Meaning you would be better off trading a breakout than a reversal. I think this whole thread is based on bogus statistics here is my code: double top = o0 + percentage * o0 / 100.0; double bot = o0 - percentage * o0 / 100.0; if ((c0 <= top && high0 > top) || (c0 >= bot && low0 < bot)) { proba++; trades++; } else...
Ignored
Maybe you should read, or re-read it if that applies, this post and try doing a study similar to what is outlined there.
{quote} I think your numbers are correct, but you're only veryfying is the price closes within +0.5 -0.5% now if you check if the price went above +0.5 then closed under +0.5, then the stats are not the same. I got around 30% hitrate then. Meaning you would be better off trading a breakout than a reversal. I think this whole thread is based on bogus statistics here is my code: double top = o0 + percentage * o0 / 100.0; double bot = o0 - percentage * o0 / 100.0; if ((c0 <= top && high0 > top) || (c0 >= bot && low0 < bot)) { proba++; trades++; } else...
Ignored
Thank you for your post. Yes, I was not asking how one would trade this, I merely wanted to confirm that my stats are correct.
CeeSo, any particular reason you say 85% when the stats from many different samples sizes indicate that it's closer to the 75% area over longer term stats to close within +.5 to -.5? From what I can see, you posted two spreadsheets showing 81% and 66%, but continually speak about 85%. Not trying to create a debate, just curious why you don't say 'somewhere between 65 - 85%', or 'in the 70's on average', or something similar. Again, I am open to the possibility that I could be looking at something differently to you.
{quote} You think wrong. The statistics are not bogus. However, how they are being (mis)used in most of the postings and by many people that clearly know very little about the subject, which can certainly make it appear that the statistics are a problem when in reality, it is the presenter that is the problem.
Ignored
well the "85%" stat is based on the assumption that 85% of the time price will close between +0.5 and -0.5
but if price doesn't cross +0.5 or -0.5 then what good does it make ? It means price will simply stay between -0.5 and 0.5 most of the time but you don't know how close from 0.5 or -0.5, how is it useful? Maybe it will stay around -0.4 for 85 out of 100 trades. then the "85%" stat is correct but how do you trade that successfully ?
{quote} Thank you for your post. Yes, I was not asking how one would trade this, I merely wanted to confirm that my stats are correct. CeeSo, any particular reason you say 85% when the stats from many different samples sizes indicate that it's closer to the 75% area over longer term stats to close within +.5 to -.5? From what I can see, you posted two spreadsheets showing 81% and 66%, but continually speak about 85%. Not trying to create a debate, just curious why you don't say 'somewhere between 65 - 85%', or 'in the 70's on average', or something...