Hi zohebo1,
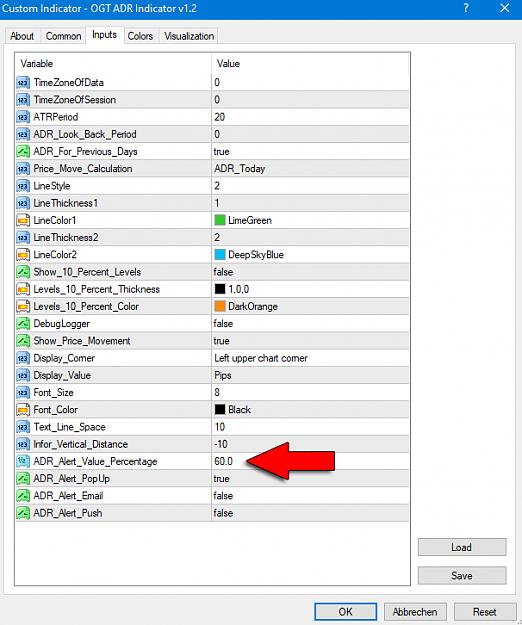
Thanks for your wonderful ADR indicator with so many options for its presentation on the chart.
But each time I switch my chart to a higher time frame than the Daily, I get repeated error messages that the "chart period is greater than 1 day". The error message continues popping up intermittently without stopping until I revert to the daily time frame or lower.
Is there a way to stop this error message popping up, because otherwise it means that one cannot use the chart to inspect price action on time
frames greater than the Daily?
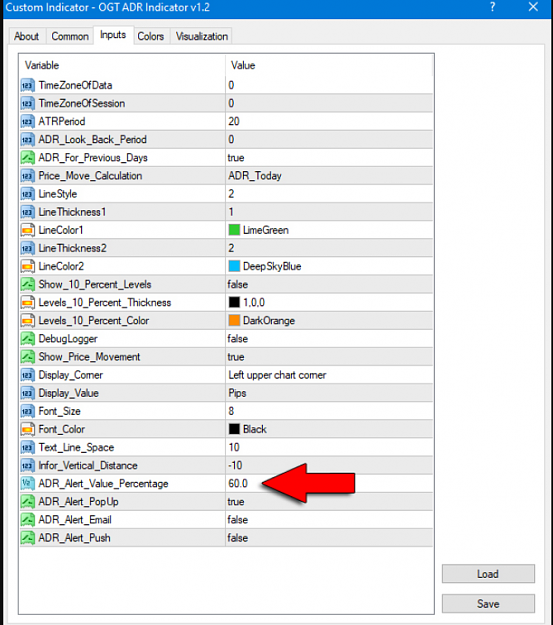