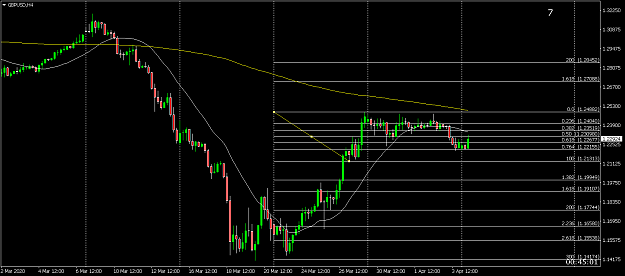
Disliked{quote} it looks nice can you please attached the moving averages that you have used in the screenshotIgnored
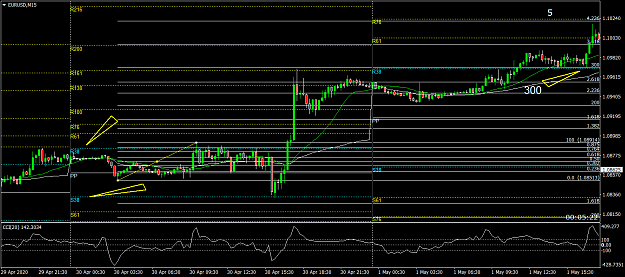
Averages give you a reference, but you can take your attention off the candles, it's good to focus more on prices.
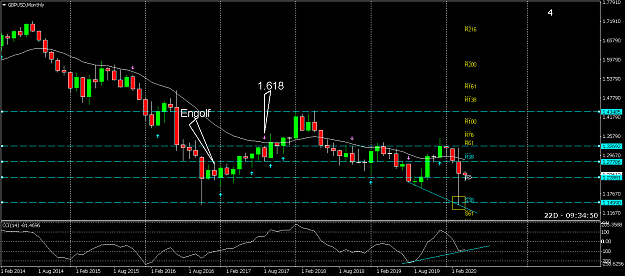
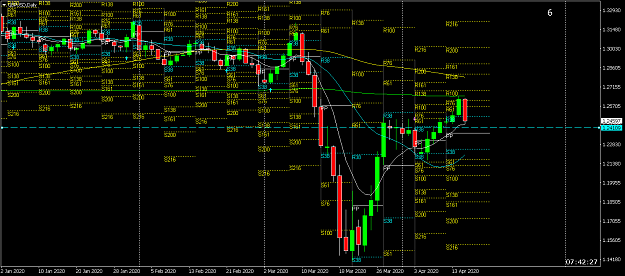
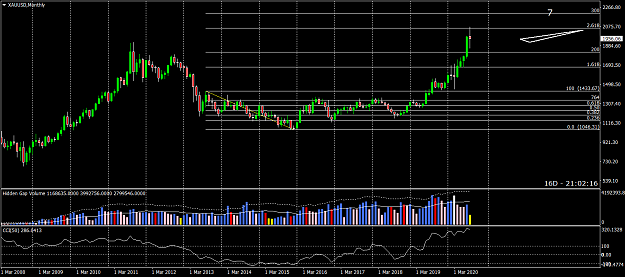
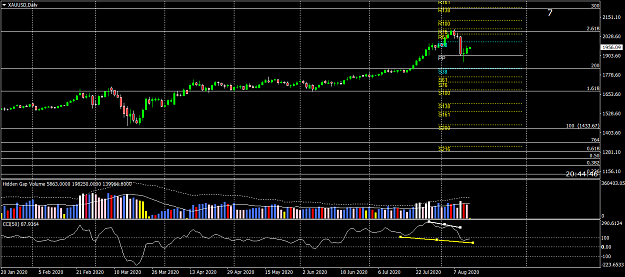
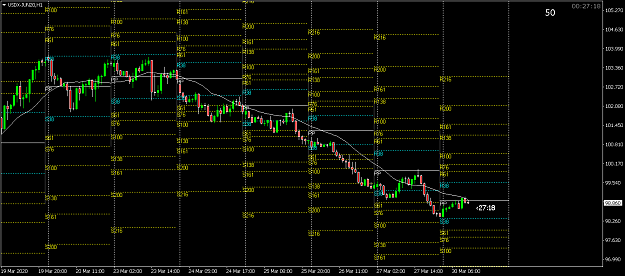
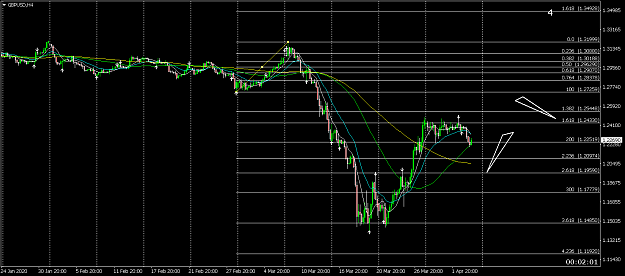
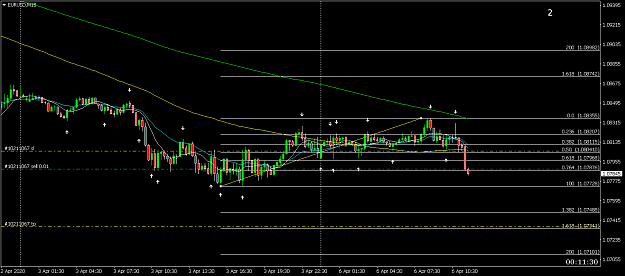
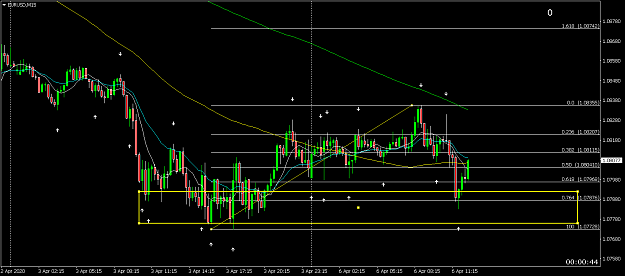
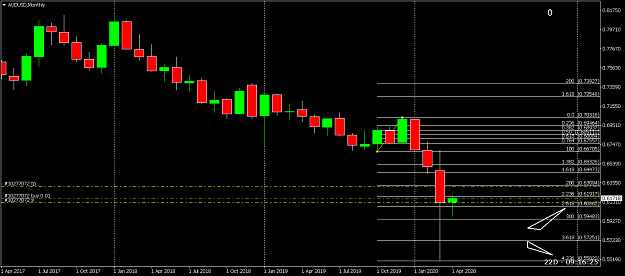
I like to use the simple averages of 8.20, 89 and 200.
In the short term I see the averages of 8 and 20, and the long term I compare the averages of 89 and 200.
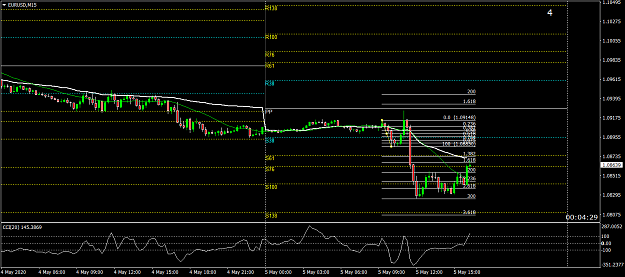
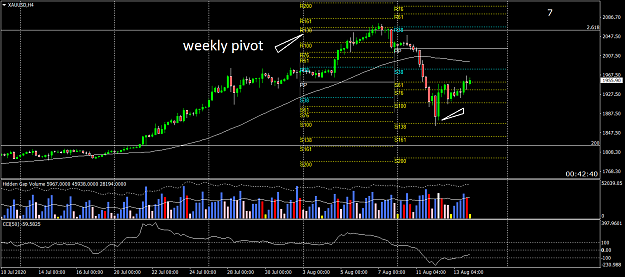
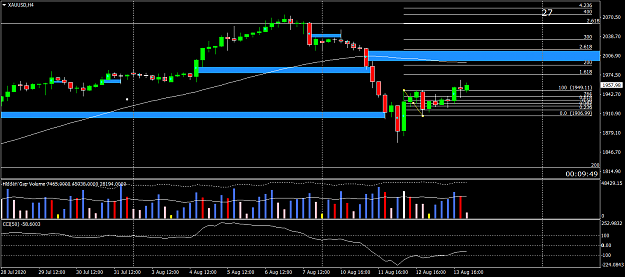
The chart I think is best is the M15, but I see the interaction with the other charts as well.
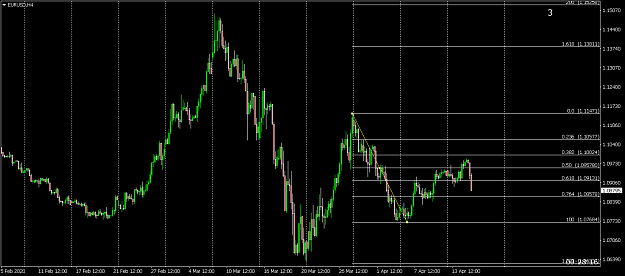
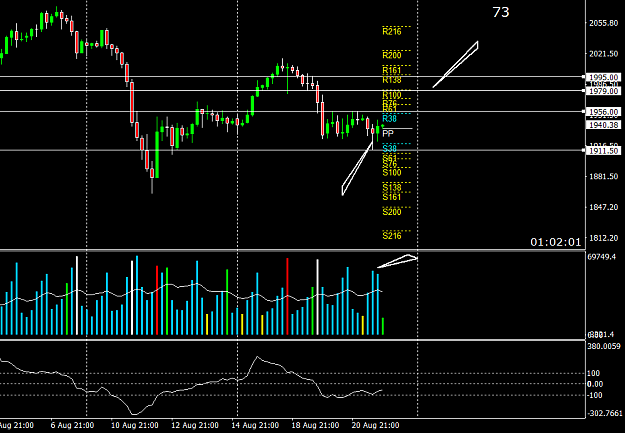
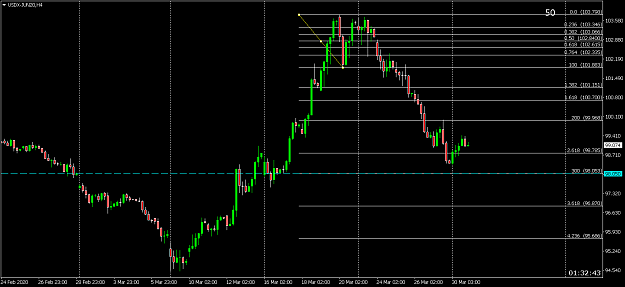
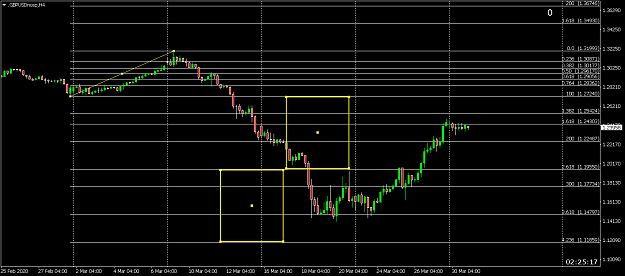
If used in conjunction with the daily fibonacci pivot points you can get a good idea of where the trend is going.
If the medians of 89 and 200 are not inclined, the market is getting sideways, if you notice that right at the average of 89, but you can also see the main pivots very close from one day to the next.
In general these are some tips.
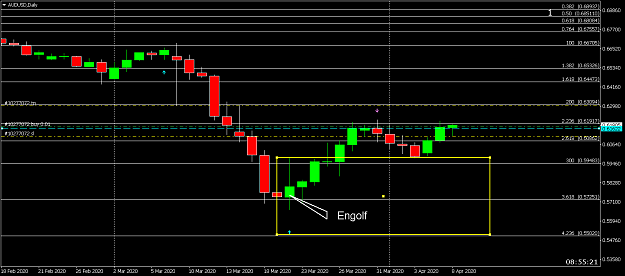
![Click to Enlarge
Name: em]ngolfo.png
Size: 51 KB](/attachment/image/3600988/thumbnail?d=1586346699)