another failure at octave 7 plus the 90 degree offset from impulse high....great great tool for alerting the trader to these areas of expected reversals...certainly helps the account lol
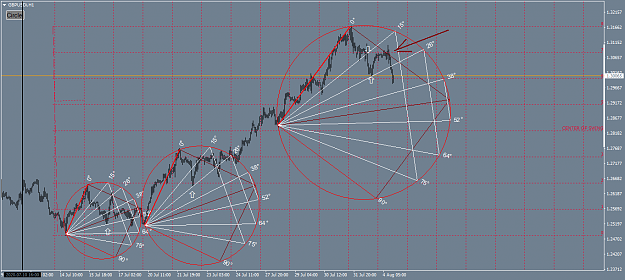
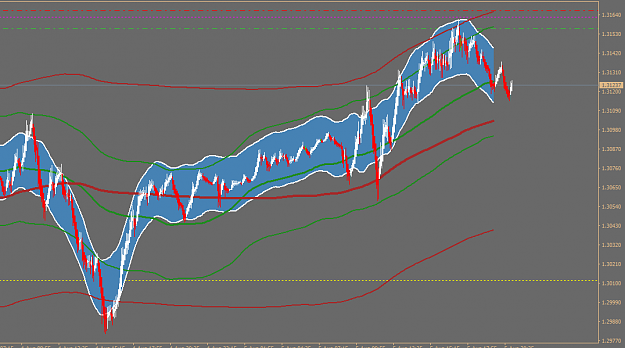
All this indicators are good Bless all and thinking its free, @Swede when is this time to draw the embem/circle on the down side?maybe you have answered this before(sorry),like your last chart,its from the bottom to top,but we had a impluse to the downside(according to me at least)something like this,maybe?
All this indicators are good Bless all and thinking its free, @Swede when is this time to draw the embem/circle on the down side?maybe you have answered this before(sorry),like your last chart,its from the bottom to top,but we had a impluse to the downside(according to me at least)something like this,maybe? {image}
Ignored
Both are correct....if you take the ultra short term trading, you may find some opportunities to take further counter trend trades.....but if you take into consideration the trend....which is strong long, then you need to consider the overall trend...and look for opportunities with the trend, not against it...
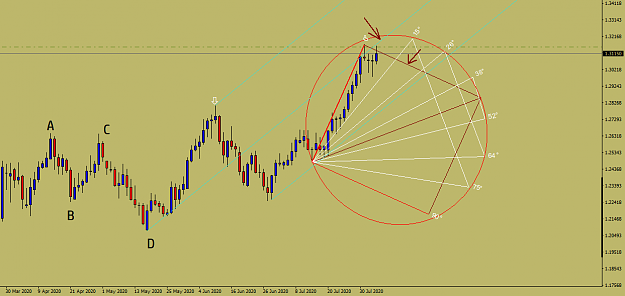
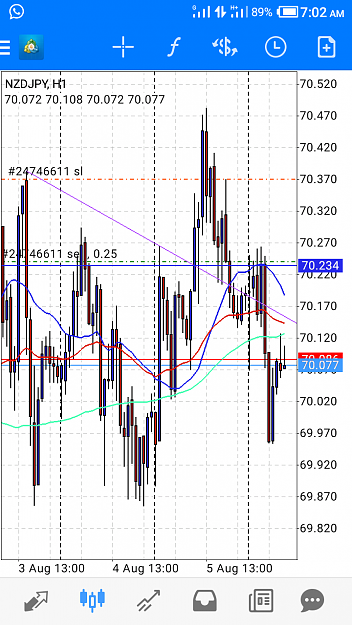
So, makenas....can you see if you stay with the trend, especially a strong trend, the emblem alerts us to support as it did yesterday on that little pull back.....then add some confluence live weekly pivots and you have a great roadmap as to direction. Price drove down to the weekly pivot and raced back north....there was the long with no drawdown....
So, makenas....can you see if you stay with the trend, especially a strong trend, the emblem alerts us to support as it did yesterday on that little pull back.....then add some confluence live weekly pivots and you have a great roadmap as to direction. Price drove down to the weekly pivot and raced back north....there was the long with no drawdown.... {image}
Ignored
yes ,i see that all clearly, i need a note on my screen to always assume the trend will last forever
{quote} yes ,i see that all clearly, i need a note on my screen to always assume the trend will last forever
Ignored
especially currencies...once they set a direction, there has to be a major shift to change direction....like tomorrow news....interest rateplus market structure plus major pivot zone = a change in direction, or a strong reaction either way....
{quote} yes ,i see that all clearly, i need a note on my screen to always assume the trend will last forever
Ignored
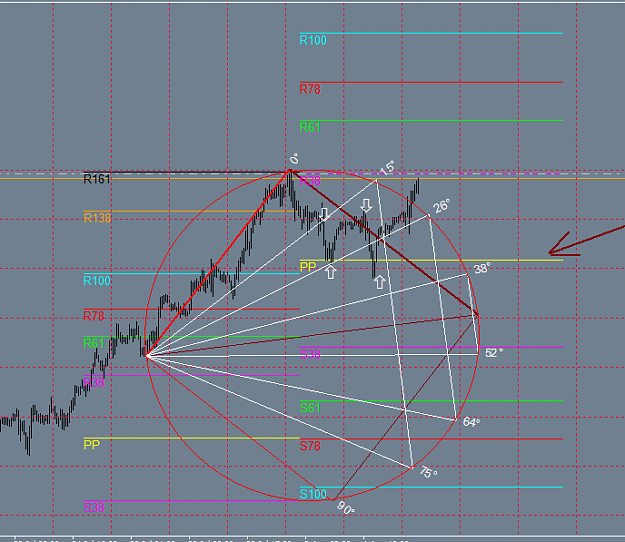
there is an old and tired saying "the trend is your friend till it ends" and that is where we are at with cable....the news tommorow could make it fly like a rocket or reverse like a boat anchor. In the mean time it has failed at R38 weekly resistance after a strong run up last week...and that is a sure sign for a few pips before news tomorrow.
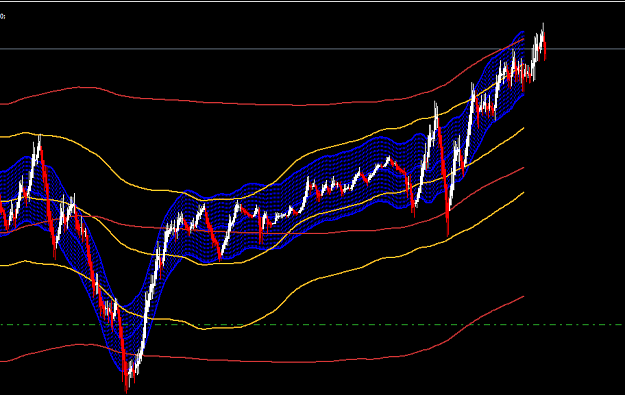
When that happens, to hone in on a precise entry, I will use an envelope method that is used and developed by parisboy in his forum....it is very good for finding oversold, overbought reversal points.....note yesterdays low....when the reversal began....I entered a small position and held till the reverse a couple hours ago....anyway just to give you another perspective.
and for additional confluence....we look at the daily chart....notice the pitchfork center....notice the 90 degree offset on the emblem....all added to the reason to get short...at least until London......
{quote} there is an old and tired saying "the trend is your friend till it ends" and that is where we are at with cable....the news tommorow could make it fly like a rocket or reverse like a boat anchor. In the mean time it has failed at R38 weekly resistance after a strong run up last week...and that is a sure sign for a few pips before news tomorrow. When that happens, to hone in on a precise entry, I will use an envelope method that is used and developed by parisboy in his forum....it is very good for finding oversold, overbought reversal points.....note...
Ignored
I tried severally to get the settings of Parisboy to no avail,i will be thankful if you can share the settings or even the template
{quote} Can u explain please, post illustration, chart etc
Ignored
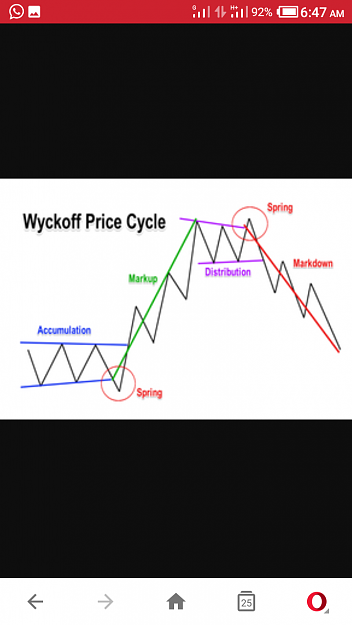
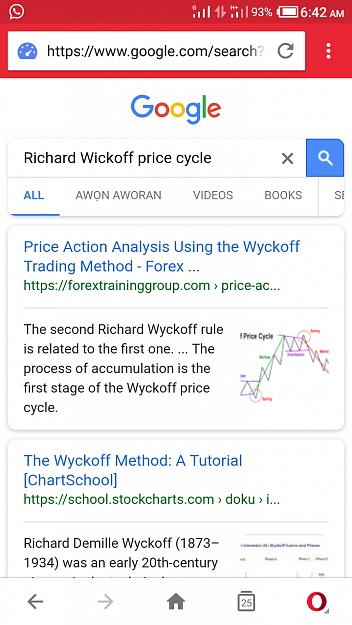
Please just Google Richard Wyckoff price cycle. I have attached some screen shots of it as a guide however I will try posting the pdf from my computer when I get home
{quote} Please just Google Richard Wyckoff price cycle. I have attached some screen shots of it as a guide however I will try posting the pdf from my computer when I get home {image} {image}
Ignored
I'm short on N/J while waiting for other pairs to complete the spring part of the cycle
{quote} OK, I think I have seen similar stuff here. Thanks. {image}
Ignored
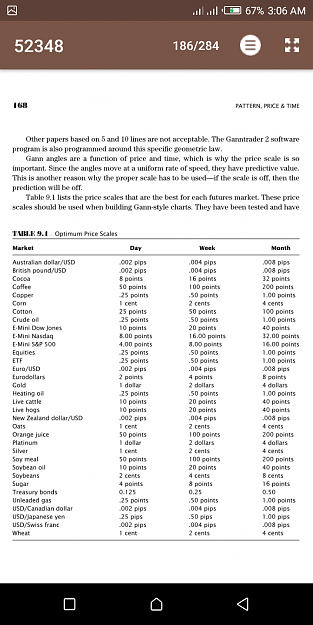
Yes that's the book I got the 20 pIps scale...I should have mentioned it in one of the posts...however as I said Bradley's price time vectors don't need scales...in a post, DM gave Bradley's PTV
So, makenas....can you see if you stay with the trend, especially a strong trend, the emblem alerts us to support as it did yesterday on that little pull back.....then add some confluence live weekly pivots and you have a great roadmap as to direction. Price drove down to the weekly pivot and raced back north....there was the long with no drawdown.... {image}
Ignored
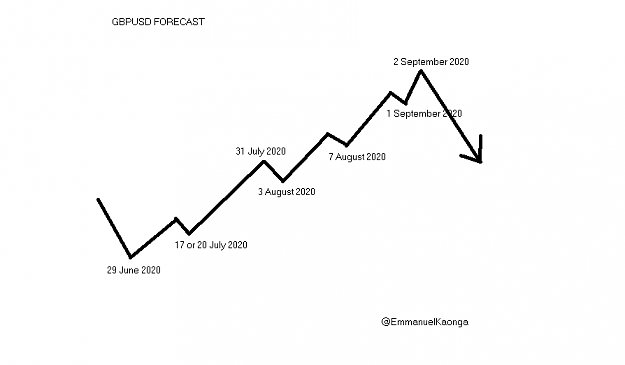
I hope you are not selling it though for the long term...because it's already started to recover from the small retracement and Friday it will already on its uptrend...I'm still holding and adding buys on the dates given
{quote} Yes that's the book I got the 20 pIps scale...I should have mentioned it in one of the posts...however as I said Bradley's price time vectors don't need scales...in a post, DM gave Bradley's PTV
Ignored
Hello, i cannot find the Bradleys Pvt,the only one i find find is a pdf Bradley F cowan posted by Parisbay, is this maybe one you are reffering to?