Me again and thank you all the gurus for your support. I am bit struggling with the emblem in the circle, so i tried few of the other pattern that was mentioned here. I dont know what exactly the name is though. So i have tried couple of option on AUDUSD 1 HR chart.
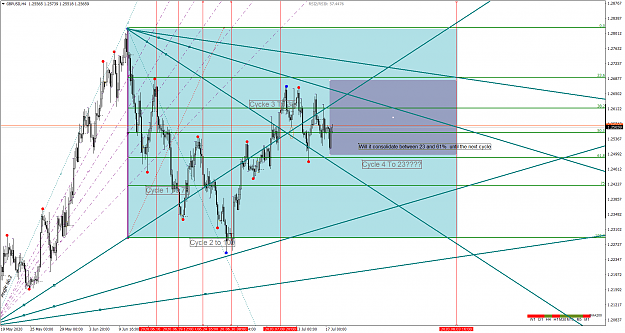
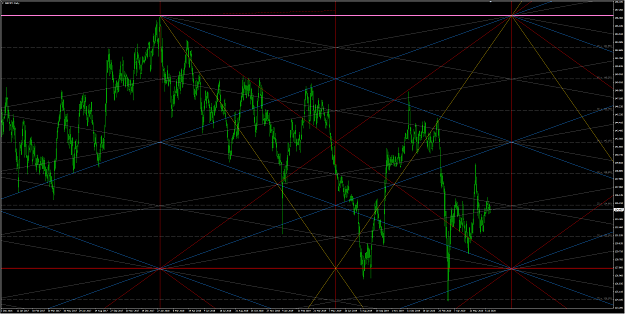
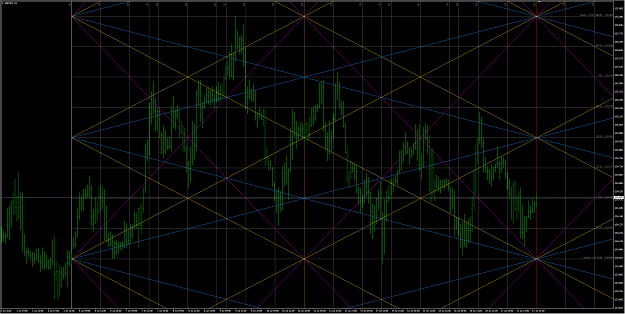
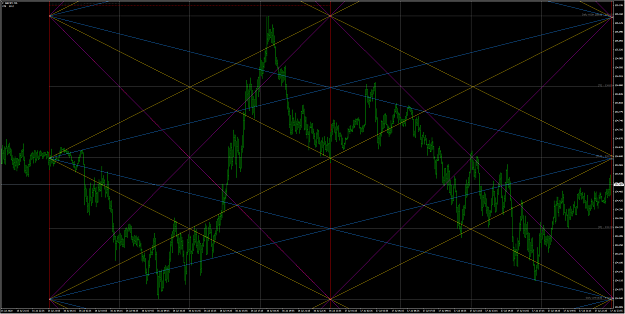
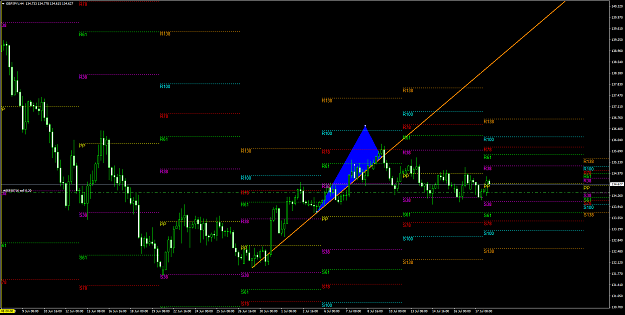
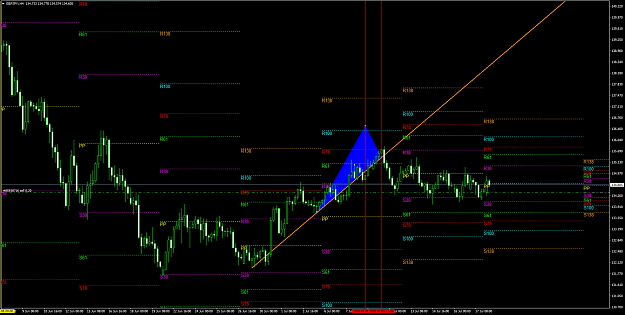
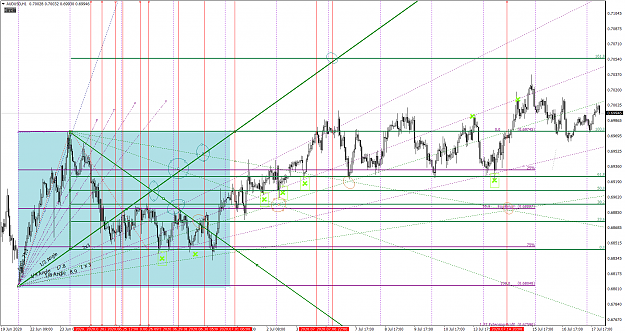
First one is the first impulse in the grid, which is purple in the chart below and seems its reacting well to the 1x3 and 1 x 2 angle on the grid. I here used the cycle lane to create my grid and then fibonacci to split in to 25,50,75,100 in to equi distance. Please correct me that is the right way to draw the grid.
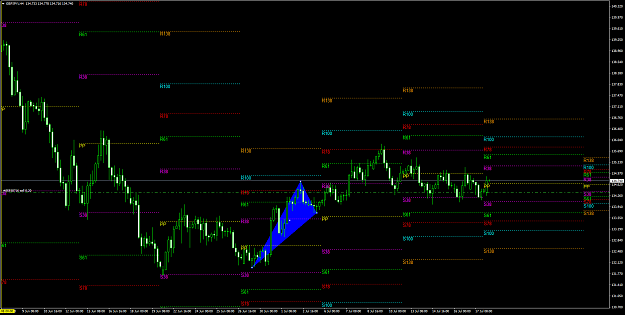
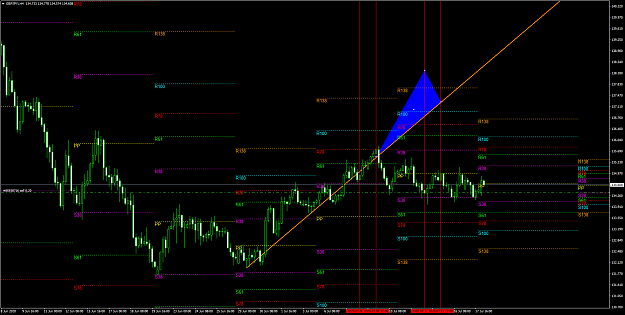
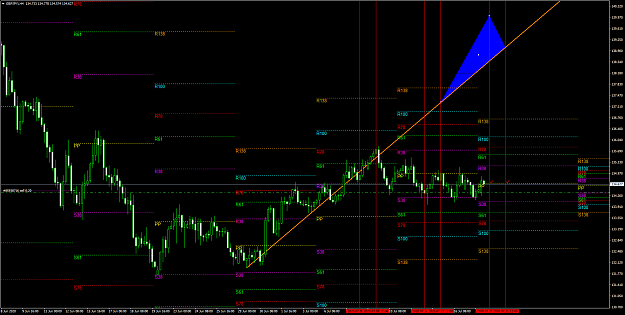
I then went ahead and used the angle of the first impulse (71.1) to draw different angles on the chart and fibonacci retracement from the high to the point of intersection from high to the 1/2 angle. This is green on the chart. Again i can see few reaction point on intersection between angle from the bottom to the angle from the top and also on the intersection of the angle with the fibonacci line.
The key point to understand here is that, like any other harmonic pattern are we saying we have to try various of this gaan pattern and see which one the currency is reacting to and then have it on chart while trading? I am still not sure when to use when as it takes bit of effort not that i am complaining but just wanted to make sure i am not missing anything
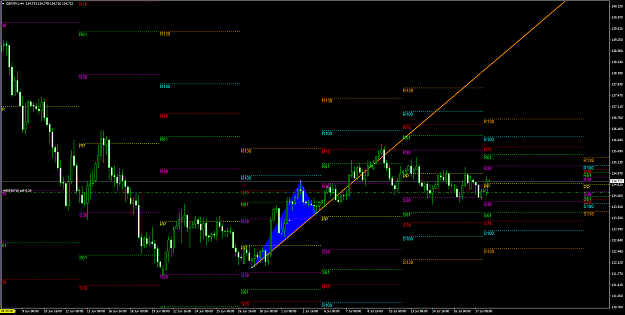
Also can we extend the fibonacci (161.8) and angle line and expect the reaction as its from 0 to 100%? Also when the chart is going out of the radar of this grid and retracement angle, do we just keep another impulse near to trading and work on it?
And yes kaoscoded, I wished it was as simple as drawing 90 degree line Swede , maneverfix priceact.fx and everyone else including , all your example and step is really helping us to understand the concept.
DiamondMiner thanks for sharing all the knowledge and the material. I still havent finish reading whole thread but earlier inthe thread you mentioned you working on some tool and website for videos, not sure if that is still under construction or its already shared on this thread already..
First one is the first impulse in the grid, which is purple in the chart below and seems its reacting well to the 1x3 and 1 x 2 angle on the grid. I here used the cycle lane to create my grid and then fibonacci to split in to 25,50,75,100 in to equi distance. Please correct me that is the right way to draw the grid.
I then went ahead and used the angle of the first impulse (71.1) to draw different angles on the chart and fibonacci retracement from the high to the point of intersection from high to the 1/2 angle. This is green on the chart. Again i can see few reaction point on intersection between angle from the bottom to the angle from the top and also on the intersection of the angle with the fibonacci line.
The key point to understand here is that, like any other harmonic pattern are we saying we have to try various of this gaan pattern and see which one the currency is reacting to and then have it on chart while trading? I am still not sure when to use when as it takes bit of effort not that i am complaining but just wanted to make sure i am not missing anything
Also can we extend the fibonacci (161.8) and angle line and expect the reaction as its from 0 to 100%? Also when the chart is going out of the radar of this grid and retracement angle, do we just keep another impulse near to trading and work on it?
And yes kaoscoded, I wished it was as simple as drawing 90 degree line
DiamondMiner thanks for sharing all the knowledge and the material. I still havent finish reading whole thread but earlier inthe thread you mentioned you working on some tool and website for videos, not sure if that is still under construction or its already shared on this thread already..
Attached Image (click to enlarge)
3