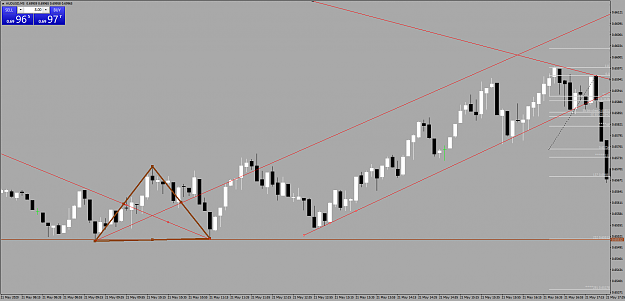
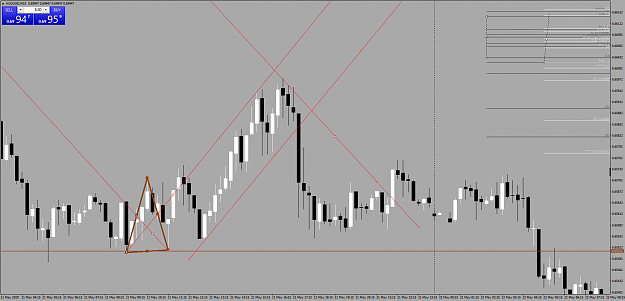
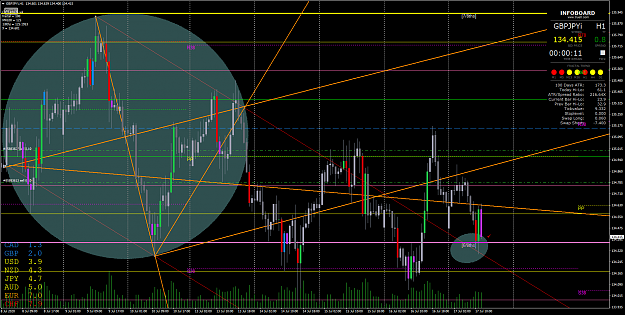
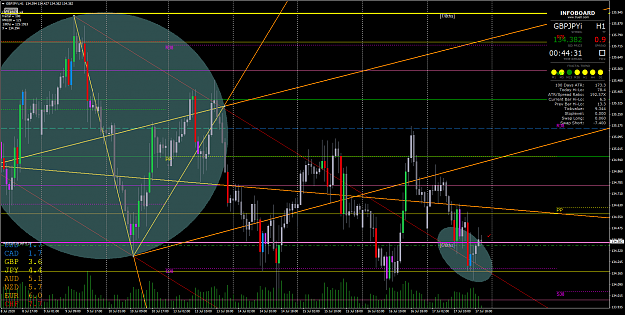
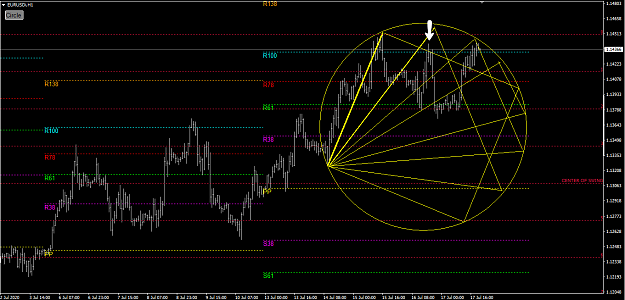
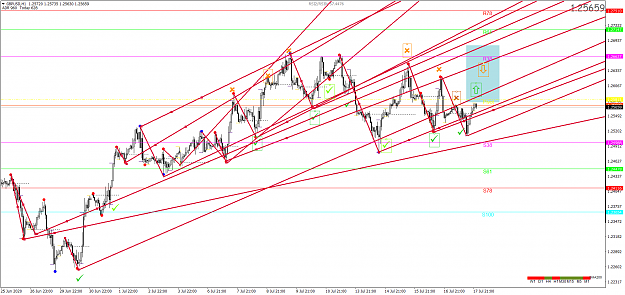
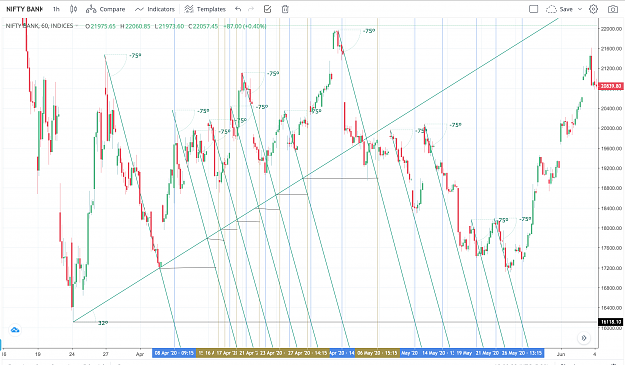
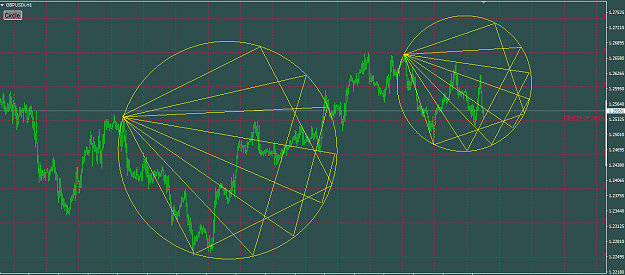
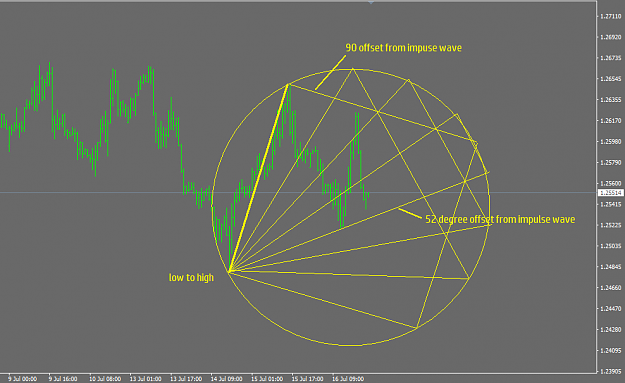
just some more illustrations, this time from high to low....hits some pretty nice places and all of this drawn in about 10 minutes using a TWO DOLLAR PROTRACTOR...LOL
3
Gann angles forecasting Method and SHIBA INU 0 replies
All the Forecasting and Prediction indicators on the market? 18 replies
Economic Indicator Forecasting by Banks: Why and how 4 replies
Anticipation vs. Forecasting 0 replies
Disliked{image} Let's go back in History https://www.forexfactory.com/showthr...5#post12489805 Now let's think... Here is a lesson plan I saved from my mentor about a decade ago. The lesson was to reveal how Support and Resistance areas can be identified many times well in advance. {image}Now looking at both of these charts tells a big story here. What we are doing is seeing where S&R play a role in figuring out where to expect a turn. If you cannot figure out how to make money now, you'd better quit trading. DMIgnored
Disliked{quote} Thanks DM Sir, for always keep me on track. This Gem has slipped out of my mind. Will dedicate this weekend for practising this.Ignored
Disliked{quote} It never has to be complicated. Most teachings are a lie, think simplicity always. Notice how Swede, keeps it simple. Somehow we as humans think a working system must be difficult, nothing is further from the truth. It's just drawing lines.Ignored
Disliked{image} Let's go back in History https://www.forexfactory.com/showthr...5#post12489805 Now let's think... Here is a lesson plan I saved from my mentor about a decade ago. The lesson was to reveal how Support and Resistance areas can be identified many times well in advance. {image}Now looking at both of these charts tells a big story here. What we are doing is seeing where S&R play a role in figuring out where to expect a turn. If you cannot figure out how to make money now, you'd better quit trading. DMIgnored
Disliked{quote} Well, I am not going to quit trading, but I could use a step by step explanation of these two charts...Ignored
Disliked{quote} Page 58 of The Secret Science: {image}{image} lets learn.Ignored
DislikedHello newbie here to learn from the gurus before they make me quit trading Trying to learn the 90 angle line on the impulse and not sure if am doing anything right here or just coincident The 90 degree angle from the last impulse become support and resistance for the next one on GBPUSD 1Hr. the chart look bit messy but hope it make sense. Not sure if its worthy of asking someone to provide comment either way please. Based on this i assume price to move up all the way up to 1.2650 and revert back to bottom of the last impulse 90 degree...Ignored
Disliked{quote} Very nice of you to post that, much appreciated because many new traders simply shut their eyes and move on when they are left to figure out the analyses used here. Now for me dealing with turning points on a chart with 2 years of data with only a few turning points is not of too much benefit overall, but give me a 1 hour chart with 2 weeks of data and you have my attention....now the analyses is the same basically, but my point is are we investors or traders? So, new traders, don’t be taken aback when you see something like this.....keep...Ignored
DislikedHello newbie here to learn from the gurus before they make me quit trading Trying to learn the 90 angle line on the impulse and not sure if am doing anything right here or just coincident The 90 degree angle from the last impulse become support and resistance for the next one on GBPUSD 1Hr. the chart look bit messy but hope it make sense. Not sure if its worthy of asking someone to provide comment either way please. Based on this i assume price to move up all the way up to 1.2650 and revert back to bottom of the last impulse 90 degree...Ignored
Disliked{quote} welcome to trading...you started on a solid path but you're only using one piece to a puzzle...sorta like trying to eat a steak and only using a fork...if it were always an omelette then yes...it would always work...unfortunately, it is never that simple...my suggestion would be for you look at the attachments that have been kindly provided by diamondminer and parisboy...understand the principles of wave theory and the beauty of geometry...if it were as simple as just using that 90 degree angle then no one would ever lose a trade my friend...but...Ignored
Disliked{quote} Kaoscoded, As this was posted earlier by myself and Parisboy it's possible it may be confusing, but a little reading and study as suggested in Post# 2,296 will answer a lot of questions. {image}Ignored
Disliked{quote} Very nice of you to post that, much appreciated because many new traders simply shut their eyes and move on when they are left to figure out the analyses used here. Now for me dealing with turning points on a chart with 2 years of data with only a few turning points is not of too much benefit overall, but give me a 1 hour chart with 2 weeks of data and you have my attention....now the analyses is the same basically, but my point is are we investors or traders? So, new traders, don’t be taken aback when you see something like this.....keep...Ignored