Hey team,
I recently re-read John Bollinger's book - Bollinger on Bollinger Bands and I really liked the idea of the Bandwidth indicator.
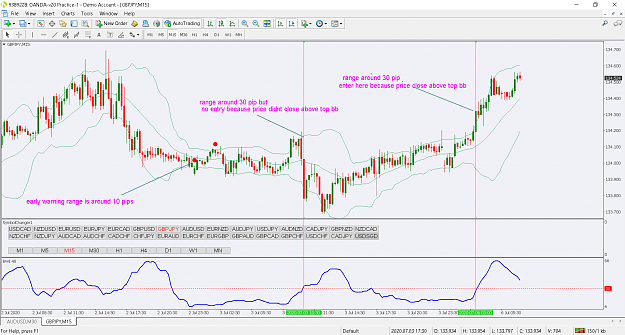
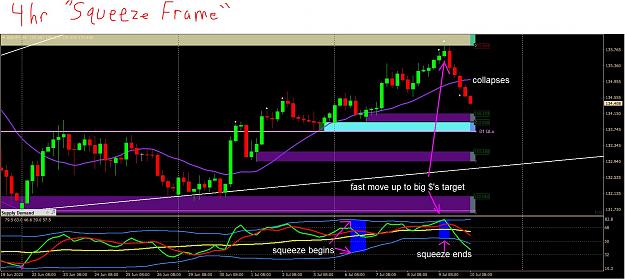
The bandwidth indicator looks at the difference in pips between the upper and lower BB and the lower the difference signifies a period of low volatility (also known as the BB squeeze). John Bollinger suggested that periods of low volatility is followed by a period of high volatility (breakout).
There are a number of Bandwidth indicators on this forum and I've modfied one to provide an alert (on chart and push) when the Bandwidth indicator drops below a certain pip value (user defined) for 2 consecutive bars.
Here are a couple of examples
In the above chart the Bandwidth indicator dropped to 2 pips (yellow area) which was followed by a 45 pip move
In the above chart we had two signals. The first (1) led to a 100 pip move and the second (2) was followed by a 95 pip move.
Hopefully you guys can see the potential power with this indicator.
Here is a video of the input settings and more examples of the indicator in action.
The indicator is not a directional indicator but more of an early warning signal a big move is about to occur. Combine it with higher time frame analysis and you can have a great strategy. I've provided the MQ4 file as I know that the great coders on here will add some great features to make this indicator better.
I recently re-read John Bollinger's book - Bollinger on Bollinger Bands and I really liked the idea of the Bandwidth indicator.
The bandwidth indicator looks at the difference in pips between the upper and lower BB and the lower the difference signifies a period of low volatility (also known as the BB squeeze). John Bollinger suggested that periods of low volatility is followed by a period of high volatility (breakout).
There are a number of Bandwidth indicators on this forum and I've modfied one to provide an alert (on chart and push) when the Bandwidth indicator drops below a certain pip value (user defined) for 2 consecutive bars.
Here are a couple of examples
In the above chart the Bandwidth indicator dropped to 2 pips (yellow area) which was followed by a 45 pip move
In the above chart we had two signals. The first (1) led to a 100 pip move and the second (2) was followed by a 95 pip move.
Hopefully you guys can see the potential power with this indicator.
Here is a video of the input settings and more examples of the indicator in action.
Inserted Video
The indicator is not a directional indicator but more of an early warning signal a big move is about to occur. Combine it with higher time frame analysis and you can have a great strategy. I've provided the MQ4 file as I know that the great coders on here will add some great features to make this indicator better.
Attached File(s)
Never stop investing. Never stop improving. Never stop doing something new


