Hey everyone, I've been trading on and off for a few years now never having the time to fully commit to trading FX. Bouncing around from this system to that system never truly being disciplined enough to stick to the rules every time I took a trade. So having actually saved up a little sum and with the quarantine these past few months I've been experimenting with different setups trying to find ways to analyze volume and pick turning points with FX pairs. I've mainly focused on three USDCAD, AUDUSD and NZDUSD.
Before I explain what the system entails, let me just say that a new trader shouldn't try to trade this system. I'm not going to explain candlestick patterns or any formation patterns that I usually just "see" and don't mark on a chart. If you're new please only demo trade if you want to try this system out.
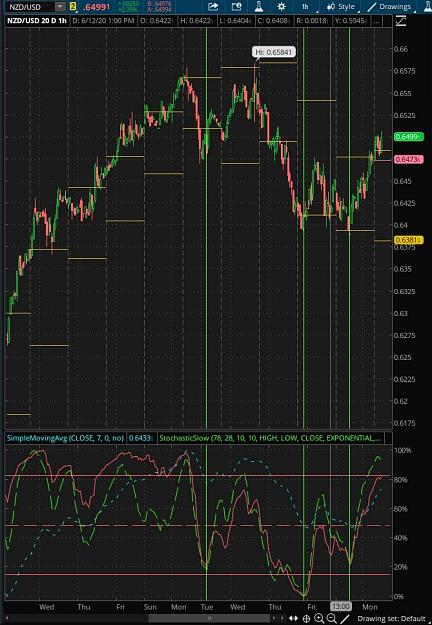
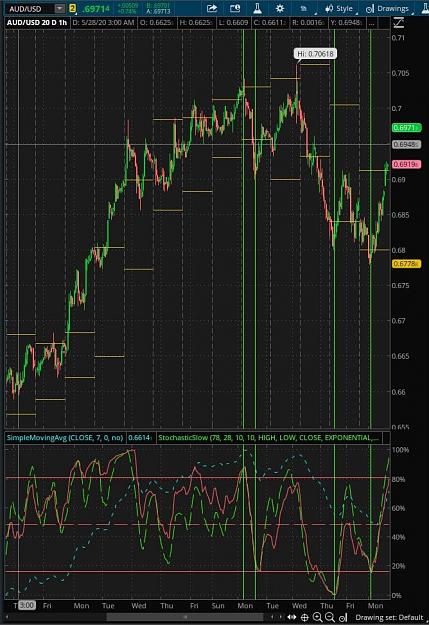
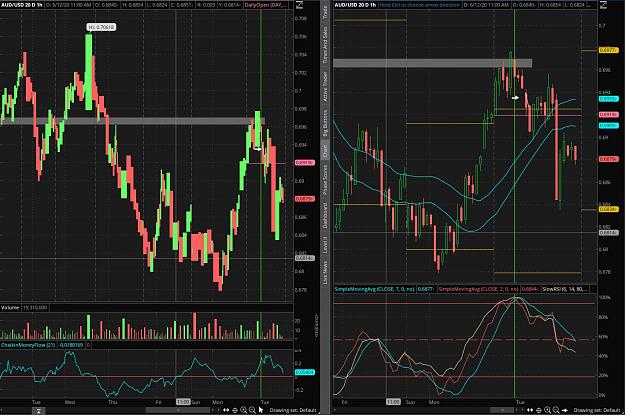
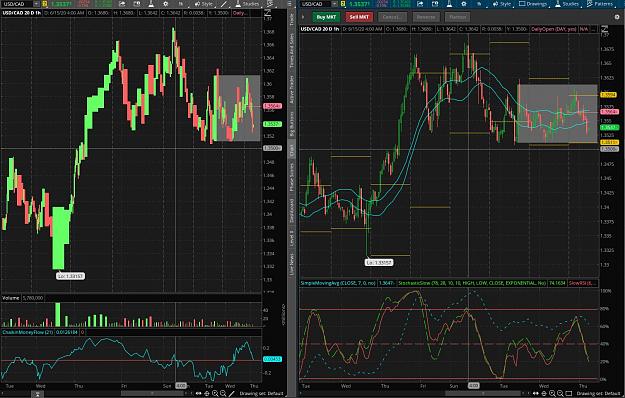
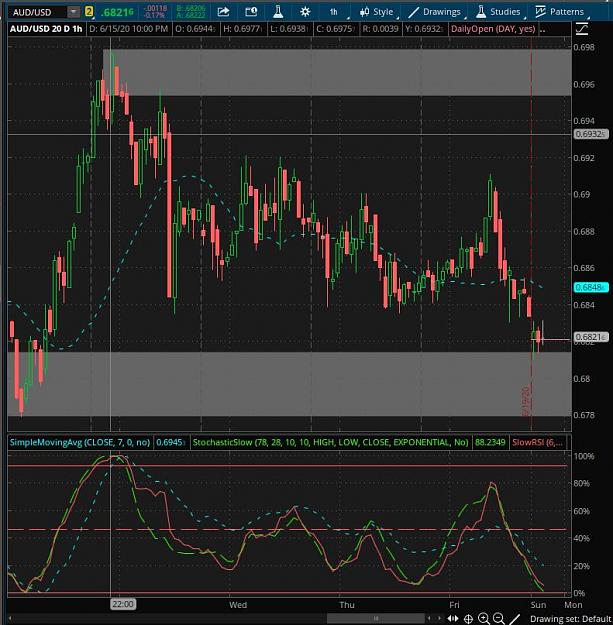
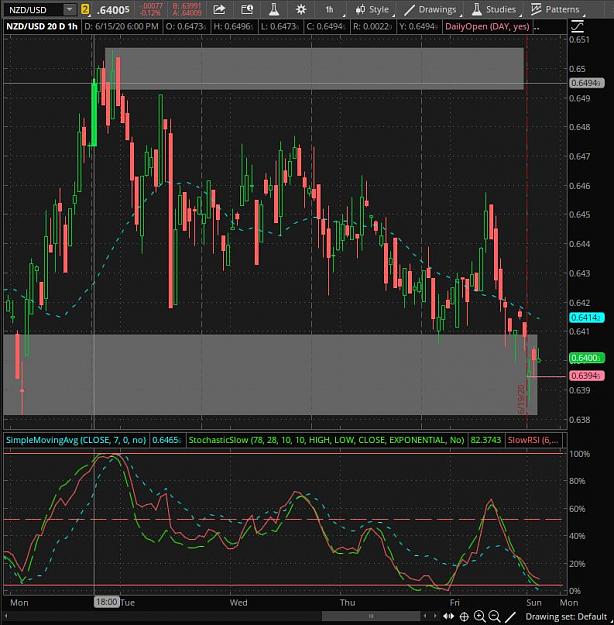
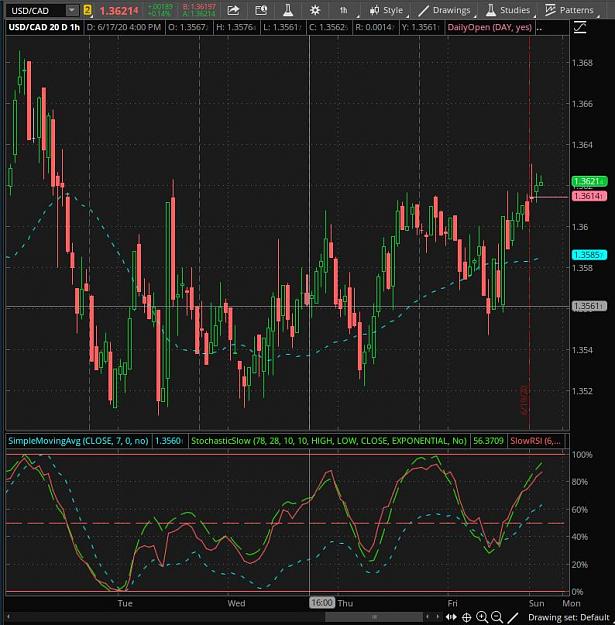
Now for the magic. A few days ago I was using a custom TDI indicator I got online somewhere that wasn't quite giving me a good read on how the price was moving and it was infuriating, to say the least. So I began trying to make a new indicator and see if I could get something similar that did what I wanted. I ended up combining the SlowRSI and the StochSlow indicators and a 7 day moving average into one indicator with amazing results for picking highs and lows. I didn't code anything and am not an expert but just a guy who stumbled got lost and ran into some treasure. Has anyone else used this type of indicator before??
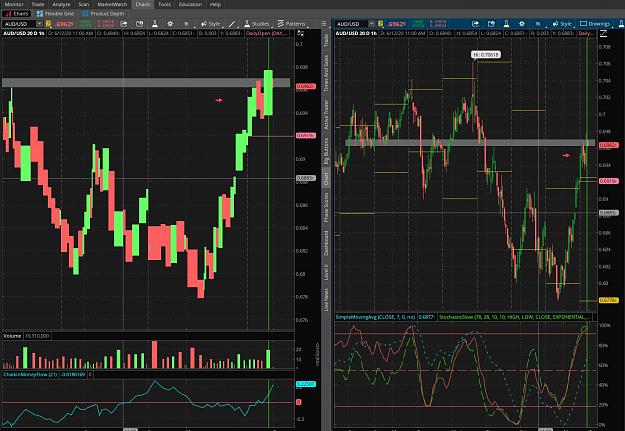
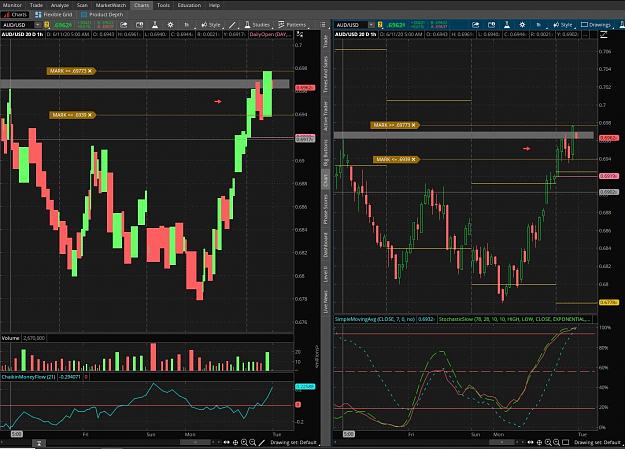
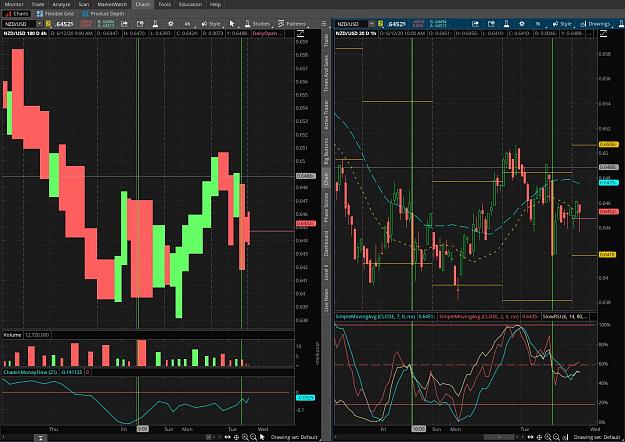
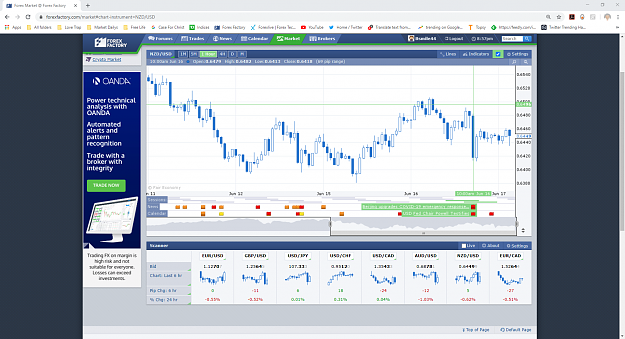
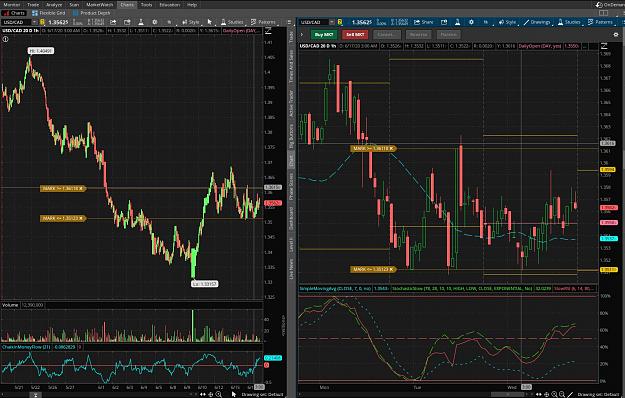
After doing some backtesting and watching price and the indicator the last 3 days, I've decided to give this system a run. The indicator I'm referring to is on the chart on the right in the image. The ones on the left are for volume only and are actually reliable when it comes to analyzing forex volume. The left chart is using Equivolume candles (Which are amazing at letting you know the volume in a move) has volume from TOS under the chart and a volume indicator called ChaikanMoneyFlow which analyzes institutional volume in an asset.
A few key points
1) This is a hybrid Supply and Demand system using these levels to establish breakout trades of consolidation
2) I analyze volume to look for divergence within a move to "help" anticipate when price might be turn
3) I use my SlowRSI-STOCH indicator to find points of exhaustion in a pair and place trades once price breaks out of that area
That is the gist and main idea of how I trade. I also look at the momentum of price itself from the candlesticks and other things and etc but like I said I'm not going to be explaining all of that. I recommend you go read some Lance Beggs or Sam Siedan's stuff to learn about price action and S/D trading if you aren't familiar with it.
Before I explain what the system entails, let me just say that a new trader shouldn't try to trade this system. I'm not going to explain candlestick patterns or any formation patterns that I usually just "see" and don't mark on a chart. If you're new please only demo trade if you want to try this system out.
Now for the magic. A few days ago I was using a custom TDI indicator I got online somewhere that wasn't quite giving me a good read on how the price was moving and it was infuriating, to say the least. So I began trying to make a new indicator and see if I could get something similar that did what I wanted. I ended up combining the SlowRSI and the StochSlow indicators and a 7 day moving average into one indicator with amazing results for picking highs and lows. I didn't code anything and am not an expert but just a guy who stumbled got lost and ran into some treasure. Has anyone else used this type of indicator before??
After doing some backtesting and watching price and the indicator the last 3 days, I've decided to give this system a run. The indicator I'm referring to is on the chart on the right in the image. The ones on the left are for volume only and are actually reliable when it comes to analyzing forex volume. The left chart is using Equivolume candles (Which are amazing at letting you know the volume in a move) has volume from TOS under the chart and a volume indicator called ChaikanMoneyFlow which analyzes institutional volume in an asset.
A few key points
1) This is a hybrid Supply and Demand system using these levels to establish breakout trades of consolidation
2) I analyze volume to look for divergence within a move to "help" anticipate when price might be turn
3) I use my SlowRSI-STOCH indicator to find points of exhaustion in a pair and place trades once price breaks out of that area
That is the gist and main idea of how I trade. I also look at the momentum of price itself from the candlesticks and other things and etc but like I said I'm not going to be explaining all of that. I recommend you go read some Lance Beggs or Sam Siedan's stuff to learn about price action and S/D trading if you aren't familiar with it.
Gentlemen always play by the rules, if they can't, they change them.