• Home
  • Forums
  • Trades
  • News
  • Calendar
  • Market
  • Brokers
  • Login
  • Join
  • User/Email: Password:
  • 7:02pm
Menu
  • Forums
  • Trades
  • News
  • Calendar
  • Market
  • Brokers
  • Login
  • Join
  • 7:02pm
Sister Sites
  • Metals Mine
  • Energy EXCH
  • Crypto Craft

Options

Bookmark Thread

First Page First Unread Last Page Last Post

Print Thread

Similar Threads

I will code your scalping EAs for no charge 36 replies

I will code your pivot EAs for no charge 18 replies

EAs and indicators relating to moutaki... 22 replies

InterbankFX has loaded its MT4 platform with custom EAs, indicators and scripts 1 reply

Need help to code EAs for MT4 and MT5 2 replies

  • Platform Tech
  • /
  • Reply to Thread
  • Subscribe
  • 35,931
Attachments: I will code your EAs and Indicators for no charge
Exit Attachments

I will code your EAs and Indicators for no charge

  • Last Post
  •  
  • 1 17641765Page 176617671768 2617
  • 1 Page 1766 2617
  •  
  • Post #35,301
  • Quote
  • May 19, 2020 6:38pm May 19, 2020 6:38pm
  •  BlueRain
  • Joined Sep 2019 | Status: Member | 843 Posts
Quoting japfx
Disliked
{quote} WOW ... i cant express how glad i am master, Please 1 more request , can you help add column for AtR value and sort base on ATR % {image}
Ignored
I added ATR next to %.


But, Sorting is not possible. ( unless there is major structure change which I won't do it. it doesn't provide any added benefit).
Output is like text file - Those are just print out of whatever value line by line.
Attached File
File Type: mq4 FXTT_Fx_Scanner.mq4   78 KB | 124 downloads
 
2
  • Post #35,302
  • Quote
  • May 19, 2020 6:40pm May 19, 2020 6:40pm
  •  BlueRain
  • Joined Sep 2019 | Status: Member | 843 Posts
Quoting tpatraders
Disliked
{quote} Oops Blue Rain, I attached the wrong indicator in the previous post that I needed the push notifications for . The correct one is attached to this post that I need the push notifications added on. Sorry about that. {file}
Ignored
Sorry, tpatraders

this one is decompiled code and I won't be able to help you.
 
 
  • Post #35,303
  • Quote
  • May 19, 2020 6:53pm May 19, 2020 6:53pm
  •  Thiagot10
  • | Joined Jan 2020 | Status: Member | 307 Posts
[quote = BlueRain; 12951228] O alerta {quote} já foi adicionado. [/ quote]


thank you my friend
thank you my friend
 
 
  • Post #35,304
  • Quote
  • May 19, 2020 6:55pm May 19, 2020 6:55pm
  •  Da.Blanchot
  • | Joined Mar 2013 | Status: Member | 34 Posts
Quoting BlueRain
Disliked
{quote} Issue understood and fixed. I added one more loop - each loop for targetprice and stoploss. {file}
Ignored

Thanks BlueRain and michymx..
May God Bless You..

 
1
  • Post #35,305
  • Quote
  • May 19, 2020 7:11pm May 19, 2020 7:11pm
  •  AKSnip
  • | Joined May 2020 | Status: Member | 12 Posts
Good Day Coders,

I have been looking for this indicator in the attached file in the forum. Can someone code the exact replica of it if not it.

It tells you when to strike/enter a trade before being bullish or bearish. Your help would be highly appreciated.

I have the code can anybody make it mt4 compatible

#grab the current stock price
current_price = r.stocks.get_latest_price(stock)[0]
#grab the strike prices
strike_list = new_df.strike_price.unique().tolist()
#add the stock price to the list and sort
strike_list_sorted = sorted(strike_list.append(current_price),key=float)
#find the index of the current price in the list
i = strike_list_sorted.index(current_price)
#refer to diagram for strike price, since they are in order they will get the closest price to the strike price
strike_a = strike_list2[i-2] #long put strike price
strike_b = strike_list2[i-1] #short put strike price
strike_c = strike_list2[i+1] #short call strike price
strike_d = strike_list2[i+2] #long call strike price
#grabbing the furthest available expiration date within the 30-45 days
exp_date = sorted(new_df.expiration_date.unique())[-1]


Or you can try with this code

#not the cleanest of code but works ¯\_(ツ)_/¯
#long put
r.orders.order_buy_option_limit(current_price, stock, 1, exp_date, strike_a, optionType='put', timeInForce='gfd')
#short put
r.orders.order_buy_option_limit(current_price, stock, 1, exp_date, strike_b, optionType='put', timeInForce='gfd')
#short call
r.orders.order_buy_option_limit(current_price, stock, 1, exp_date, strike_c, optionType='call', timeInForce='gfd')
#long call
r.orders.order_buy_option_limit(current_price, stock, 1, exp_date, strike_d, optionType='call', timeInForce='gfd')
Attached Image (click to enlarge)
https://www.forexfactory.com/attachm...1&d=1589681287
 
 
  • Post #35,306
  • Quote
  • May 19, 2020 7:14pm May 19, 2020 7:14pm
  •  Da.Blanchot
  • | Joined Mar 2013 | Status: Member | 34 Posts
Quoting Da.Blanchot
Disliked
morning guys.. I have one more idea need help from coders to make it work.. I'm really sorry I don't have the source code for you guys to work on.. cja has successfully made one which is literally the closest 'open levels with xx pips' to what I need.. here's what need to be add as a plus point from what cja has created.. 1. option to add 'time setting' as the 'starting point to calculate the levels from. cja's one is fixed to open daily level as the starting point. for example at 00:00, 04:00, 08:00, etc and each time setting is user preference.....
Ignored

this is the basis source code for level lines i can find..
wonder if you guys can work on it.. can't find better source code..
Attached File
File Type: mq4 Waddah Attar Daily Fibo.mq4   8 KB | 82 downloads
 
 
  • Post #35,307
  • Quote
  • May 19, 2020 7:35pm May 19, 2020 7:35pm
  •  Thiagot10
  • | Joined Jan 2020 | Status: Member | 307 Posts
friends what better indicator for binary options?
 
 
  • Post #35,308
  • Quote
  • May 19, 2020 9:19pm May 19, 2020 9:19pm
  •  tpatraders
  • | Joined Oct 2019 | Status: Member | 51 Posts
Quoting BlueRain
Disliked
{quote} Sorry, tpatraders this one is decompiled code and I won't be able to help you.
Ignored
Ok thank you anway!
 
 
  • Post #35,309
  • Quote
  • May 19, 2020 9:29pm May 19, 2020 9:29pm
  •  Phylo
  • Joined Feb 2012 | Status: Member | 1,725 Posts
Quoting RomualdaKey
Disliked
{quote} Thank you!
Ignored
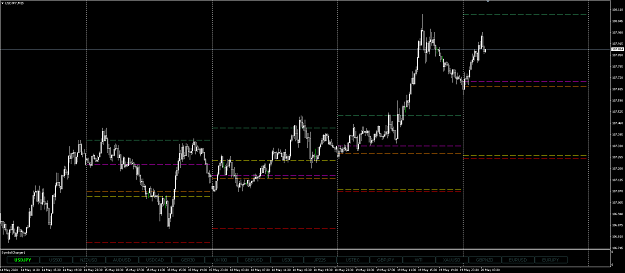
- may as well post - Prev Day OHLC + Mid HL + Mid OC
- others may find of use and may be of use later
Attached Image (click to enlarge)
Click to Enlarge

Name: Z-99.PNG
Size: 54 KB
Attached File
File Type: ex4 Prev_Day_OHLC_MID.ex4   17 KB | 129 downloads
 
3
  • Post #35,310
  • Quote
  • May 19, 2020 10:22pm May 19, 2020 10:22pm
  •  T4Trade
  • Joined Sep 2017 | Status: Trend Following,Price Action,Grid | 1,949 Posts | Online Now
Mentors ,please change XIT fibonacci indicator to take the yesterday high and low swing,at the moment,it takes multiple days swing and then it keeps updating the swings during the day,thanks a million.
Attached Files
File Type: ex4 XIT_FIBS with Color Option Modi (1).ex4   9 KB | 80 downloads
File Type: mq4 XIT_FIBS with Color Option Modi (1).mq4   6 KB | 89 downloads
 
 
  • Post #35,311
  • Quote
  • May 19, 2020 10:41pm May 19, 2020 10:41pm
  •  WizGizmo
  • | Joined Jun 2017 | Status: Junior Member | 5 Posts
Quoting mntiwana
Disliked
{quote} Hi Wizgizmo The ver you posted, is of "Igor" renamed and or derived from HMA (Hull Moving Average) - also old enough TSR and MA in color both can possibly repaint at some stage why can't you find some/any properly coded and latest one HMA (there are a lot around,almost with alerts,arrows and a lot more included too) as they are the same thing,in example picture applied both with same attributes,simply i shifted 1 digit to be visible {image}
Ignored
Thanks mntiwana. I will look for the ones you have suggested.
 
 
  • Post #35,312
  • Quote
  • May 19, 2020 11:54pm May 19, 2020 11:54pm
  •  ScALpipTaToE
  • | Joined Oct 2019 | Status: Member | 43 Posts
Hi coders,

Is it possible to plot a hline at the price during a specific time (preferably to the seconds), say 00:50:30 GMT?

Thanks
 
 
  • Post #35,313
  • Quote
  • Edited at 3:17pm May 20, 2020 1:29am | Edited at 3:17pm
  •  Phylo
  • Joined Feb 2012 | Status: Member | 1,725 Posts
Quoting ScALpipTaToE
Disliked
Hi coders, Is it possible to plot a hline at the price during a specific time (preferably to the seconds), say 00:50:30 GMT? Thanks
Ignored
- not on MT4 standard times because the minimum timeframe is M1 and M1 candles can only start on increments of 1 minute of the hour (minutes - 0,1,2,3 etc) - not on 30 second increment of the hour.
- likewise MT4 standard M5 candles can only start at increments of 5 minutes of the hour (minutes - 0,5,10,15,30, etc) and not increments of 6 minutes of the hour.
- a vertical line time set at 09:10 can only be accurately represented on MT4 standard timeframes M1 and M5 because each have increments that intersect at 10 minutes - but not on any timeframe above M5 because non above have increments that intersect at 10 minutes.
- a time of 09:10 on a timeframe of M15 will fall on/between the 09:00 - 09:15 candle and on M30 on/between the 09:00 - 09:30 candle - a 09:10 time vertical line will be represent on/between the 09:00-09:15 candle that starts at 09:00 etc - so the 09:10 vertical line will be positioned at 09:00.
- the same scenario will occur with 00:50:30

Indicators and EA are available to enable smaller and larger MT4 timeframes
- my experience, in this respect, is with OVO a commercial product - $45 lifetime license for 3 machines (highly recommended)* but that has long been sidelined in favor of Sierra Chart - a professional multi broker and charting package which includes a historical simulator - 1 second and tick charts - considerably more powerful than MT4 - initial steep leaning curve - if interested in either or similar see online and online video.

* another well known commercial product is available but not recommended as the license is too heavily linked to the vendors servers which proved to slow MT4 performance - as soon as the product was removed MT4 returned to fast normal performance.
 
1
  • Post #35,314
  • Quote
  • May 20, 2020 1:32am May 20, 2020 1:32am
  •  T4Trade
  • Joined Sep 2017 | Status: Trend Following,Price Action,Grid | 1,949 Posts | Online Now
phylo u started ignoring me because i asked mentors to assist me? is this how graceful you are? if you dont like any request ,just simply pass it.ignoring someone is so hurtful, anyways this shows your manners.
1
 
  • Post #35,315
  • Quote
  • May 20, 2020 1:33am May 20, 2020 1:33am
  •  DroidM
  • | Joined May 2020 | Status: Junior Member | 8 Posts
I scalp the M1, M5, M15 chart using the divergence strategy and the indicators i use is bollinger bands and RSI. I currently need help in coding a part of the EA for this strategy. I trade when the market is volatile, meaning with the bollinger bands are wide and almost parallel, the problem with my bot now is it even picks up bollinger bands squeezes as trade setups and this is where my problem lies, how do i code the part where the Bollinger bands between the high and the higher high on the price are almost parallel, to filter out the squeezes and flared out bands.
Thank you.
 
 
  • Post #35,316
  • Quote
  • May 20, 2020 1:42am May 20, 2020 1:42am
  •  xenosteh
  • | Joined Aug 2016 | Status: Junior Member | 4 Posts
Hello guys, I need help coding an indicator.

I would like to create a color histogram bar showing green when the indicators show an uptrend, red when indicators show downtrend and yellow when uncertain. Something similar to Kijun Slope Histo (as attached).

The indicators involved are MACD and LinearRegSlope (as attached).

The rules are as follows:

When current MACD > previous MACD && current LinearRegSlope > previous LinearRegSlope = Green
When current MACD < previous MACD && current LinearRegSlope < previous LinearRegSlope = Red
When current MACD > previous MACD && current LinearRegSlope < previous LinearRegSlope = Yellow
When current MACD < previous MACD && current LinearRegSlope > previous LinearRegSlope = Yellow

Basically when both current indicator values are lower then previous values, indicator indicator shows red. When both current values are higher than previous values, histogram shows green. When the current value of one is higher than previous but the other is opposite, show yellow.

MACD values refer to the main (histogram) value only. The signal value is ignored.

Thanks in advance for any help you guys can give.
Attached Files
File Type: mq4 LinearRegSlope v1.mq4   3 KB | 90 downloads
File Type: mq4 Kijun slope histo.mq4   6 KB | 94 downloads
 
 
  • Post #35,317
  • Quote
  • May 20, 2020 3:03am May 20, 2020 3:03am
  •  BlueRain
  • Joined Sep 2019 | Status: Member | 843 Posts
Quoting DroidM
Disliked
I scalp the M1, M5, M15 chart using the divergence strategy and the indicators i use is bollinger bands and RSI. I currently need help in coding a part of the EA for this strategy. I trade when the market is volatile, meaning with the bollinger bands are wide and almost parallel, the problem with my bot now is it even picks up bollinger bands squeezes as trade setups and this is where my problem lies, how do i code the part where the Bollinger bands between the high and the higher high on the price are almost parallel, to filter out the squeezes...
Ignored
Check this thread
https://www.forexfactory.com/showthread.php?t=701858

You might be able to use BB histogram to measure if BB is volatile or sqeeze.
 
1
  • Post #35,318
  • Quote
  • Edited at 11:53am May 20, 2020 3:14am | Edited at 11:53am
  •  jeanlouie
  • Joined Dec 2010 | Status: Member | 1,225 Posts
Quoting KayStreet
Disliked
{quote} ___ jeanlouie, As per the 2 issues mentioned earlier, #2. is sorted. ____ #1. still has a problem. At point A, the average of 10 candles is .16. At point B, the average is .24. Since average increases from .16 to .24, if my analysis is right, i would expect the bear line to drop since the speed had fallen compared to point B. {image}
Ignored
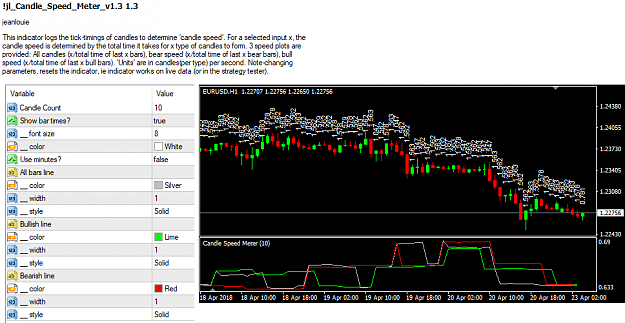
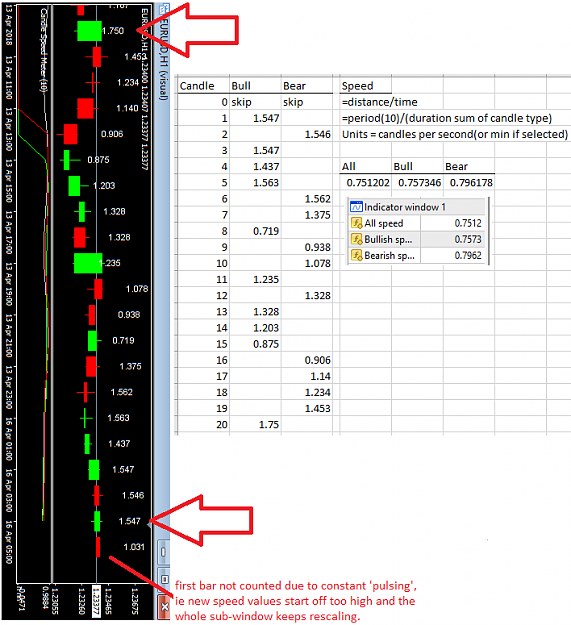
The pic and your numbers are correct, it measures bar durations, but that was just fundamentally wrong. This measures candle speed now, as in x candles per time it took those candles to form, units are candles/second, or minute if its selected. Because fresh new ticks rate with super high speed values, the line tip re-scales the whole graph, if you set a max on it then it still starts high and floats down to it's final state, but it's not a proper representation of "forming" the final speed, so I left out the current candle, see gif of the pulsing. Also checked the calcs again see pic, increased the duration prints on the chart to 3 decimal places as rounding errors were too big previously.

Candle_Speed_Meter v1.3
- measures candle speed using tick-timing of first-last ticks in a candle
- calculated as x candle types / time it took for those x candles to form
- candle types are all, bull only, bear only
- ie x=10, all=last 10 candles, bull=last 10 bull candles, bear=last 10 bear candles
- graph leaves out the live first candle due to display issue, indicator works on completed candles
- changing inputs, resets the indicator, only works on new values (live data or in strategy tester)

update v1.32- handles no data or time rounds to zero somewhere, appears in non-standard tfs
Attached Image (click to enlarge)
Click to Enlarge

Name: candle speed meter v1.3 pic 1.png
Size: 50 KB

checking calcs
Attached Image (click to enlarge)
Click to Enlarge

Name: candle speed meter v1.3 pic 2.png
Size: 53 KB

pulsing issue to calc on frist candle
Attached Image
Attached File
File Type: ex4 Candle_Speed_Meter_v1.32.ex4   20 KB | 93 downloads
 
3
  • Post #35,319
  • Quote
  • May 20, 2020 3:34am May 20, 2020 3:34am
  •  Kylce
  • | Joined Jan 2011 | Status: Junior Member | 3 Posts
Dear Expert Programmers,
I need this stochastic indicator attached to have sound and email alerts.
It is very simple.
a. If stoch line and signal line are in OB area and stoch line < signal line
b. Then I need alerts
c. If stoch line and signal line are in OS area and stoch line > signal line
d. Then I need alerts

· I need options to set OB and OS
· I need options for sound and email alerts ( true and false )
· Base on closing candle
Attached File
File Type: mq4 Color Stochastic.mq4   5 KB | 62 downloads
 
 
  • Post #35,320
  • Quote
  • May 20, 2020 4:28am May 20, 2020 4:28am
  •  KayStreet
  • | Joined Mar 2014 | Status: Member | 188 Posts
Quoting jeanlouie
Disliked
...Candle_Speed_Meter v1.3.....
Ignored
____
Thank you J.
Testing & will surely be back.
L.L.L.T
 
 
  • Platform Tech
  • /
  • I will code your EAs and Indicators for no charge
  • Reply to Thread
    • 1 17641765Page 176617671768 2617
    • 1 Page 1766 2617
8 traders viewing now, 3 are members:
Zookeeper85
,
Invisible
,
jonjon0711
  • More
Top of Page
Forex Factory Blog Updated: Alerting All Members
  • Facebook
  • Twitter
About FF
  • Mission
  • Products
  • User Guide
  • Media Kit
  • Blog
  • Contact
FF Products
  • Forums
  • Trades
  • Calendar
  • News
  • Market
  • Brokers
  • Trade Explorer
FF Website
  • Homepage
  • Search
  • Members
  • Report a Bug
Follow FF
  • Facebook
  • Twitter

FF Sister Sites:

  • Metals Mine
  • Energy EXCH
  • Crypto Craft

Forex Factory® is a brand of Fair Economy, Inc.

Terms of Service / ©2022