I received a couple of requests over on the Timing Solution group to explain how I create the prediction each week. I just made a short video on how I run the software for my predictions. Although I demonstrate using Gold, I have not back tested it at all.. I like to stick with EUR/USD... the method is the same though. https://youtu.be/ZVj2sJ7Wyfk
I found this table about the effect of the aspects in various planets. However, this is only written about conjunction angel and I did not find anything similar for other important angles.(opposition,square,sextile,trine) Can anyone help? https://bradleysiderograph.com/major-planetary-aspects/ {image}
{quote} Ah, that is a bigger issue... I use FXCM Data downloader to specify any date, any time frame. That is software that I have had for a few years... I haven't looked into it lately in terms of cost. Yahoo Finance, Quandl and others offer free data. Dukascopy is a good source bu I don't know how far back they go...
Ignored
yes is this big issue for financial astrology, i'll check
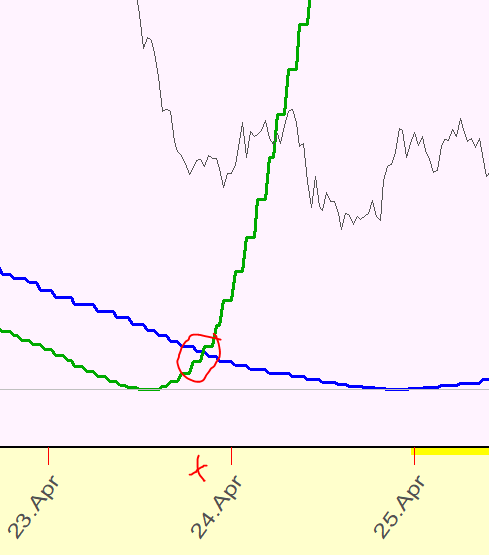
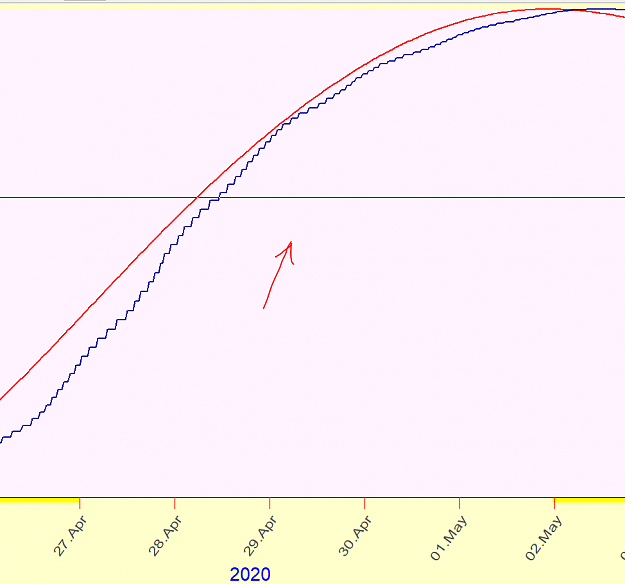
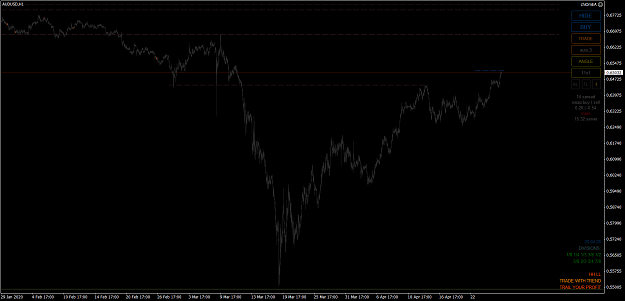
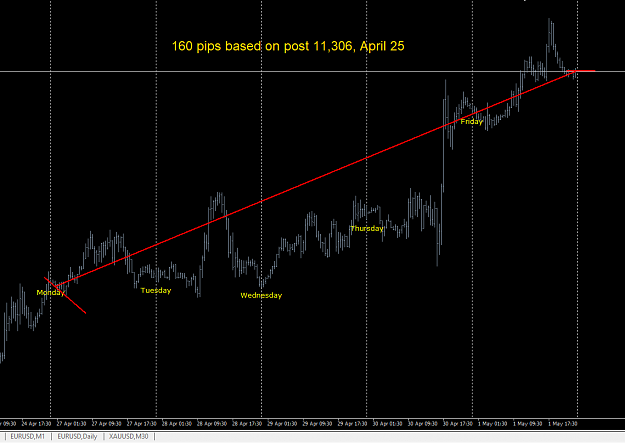
Outlook for next week.... Red is spectrum study and blue is Moon-Sun 1/5 h 50% sm orb as outlined in video above. 66 day cycle slider was pushed all the way to the right to align the curve with the Friday reversal. (image 2)
Outlook for next week.... Red is spectrum study and blue is Moon-Sun 1/5 h 50% sm orb as outlined in video above. 66 day cycle slider was pushed all the way to the right to align the curve with the Friday reversal. (image 2) {image} {image}
Outlook for next week.... Red is spectrum study and blue is Moon-Sun 1/5 h 50% sm orb as outlined in video above. 66 day cycle slider was pushed all the way to the right to align the curve with the Friday reversal. (image 2) {image} {image}
{quote} Sir would you help me setting my astrolog 4.0. I anylize chart using trading view (oanda). Im confuse how to set coordinate. Time and daylight. Thnnks
Outlook for next week.... Red is spectrum study and blue is Moon-Sun 1/5 h 50% sm orb as outlined in video above. 66 day cycle slider was pushed all the way to the right to align the curve with the Friday reversal. (image 2) {image} {image}
Ignored
Thank you for new week prediction. I think EurUsd has a good chance to go up too this week since EurUSd usually runs up for the month end.
Last week, you had those black line for similarity function for the week...I really like that .. I have to say it blows my mind sometimes.. with mirror images of two periods...
I wonder ..do you have the one for this week?
I really enjoy to read your posts. Thanks for your generous help
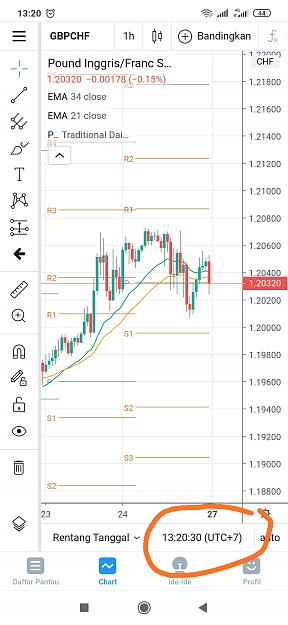
{quote} In my trading view the timezone setting utc+7 sir. Should i change it? {image}
Ignored
If your data feed is UTC +7, then yes, change Astrolog to match it. My data through MT4 is UTC +2... even though I am near New York City, I set up Astrolog for Moscow.
{quote} Thank you for new week prediction. I think EurUsd has a good chance to go up too this week since EurUSd usually runs up for the month end. Last week, you had those black line for similarity function for the week...I really like that .. I have to say it blows my mind sometimes.. with mirror images of two periods... I wonder ..do you have the one for this week? I really enjoy to read your posts. Thanks for your generous help
Ignored
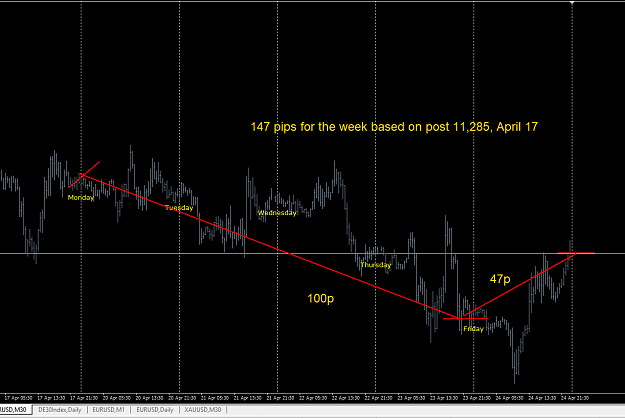
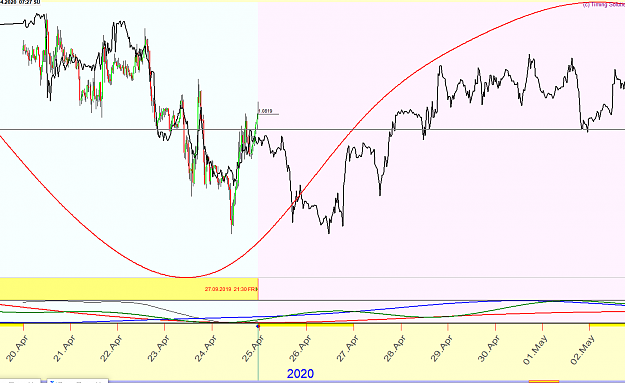
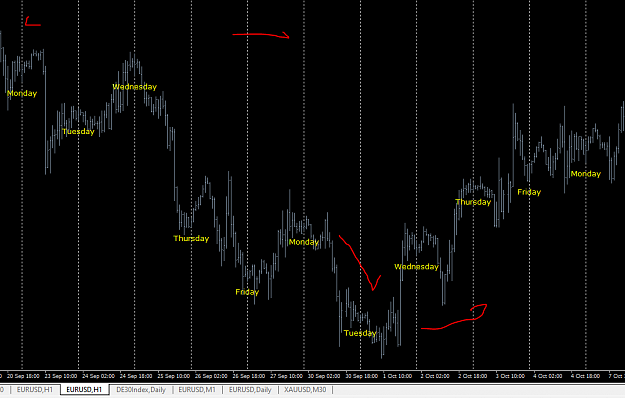
Hi Boulder... Here you go... The black line price action was from the week ending September 27, 2019.
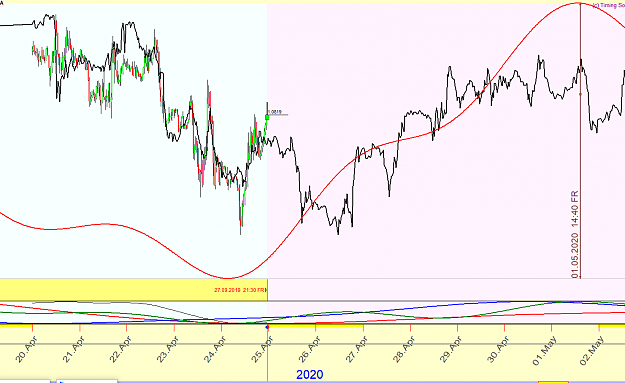
In the 2nd image, I clicked "optimize" on the Harmonic box and got a more nuanced red curve. It indicates that you should exit before the start of the NY session on Friday. I always feel Friday is the wild card. Price may or may not follow the prediction, especially for the NY session.. it is best to use regular TA at that point.
In the third, I am showing the 1 hr mt4 chart for the period in the similarity line. Notice the drop after the open on Monday, Sept 30? My price chart has inserted the week end so the black line is dropping on Saturday... but we know it was Monday.
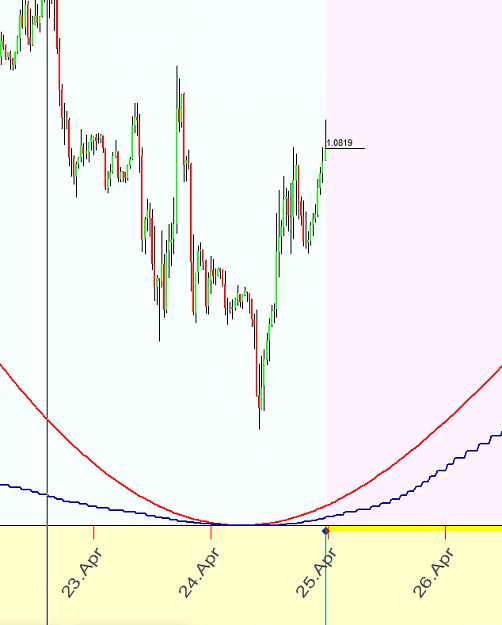
{quote} Hi Boulder... Here you go... The black line price action was from the week ending September 27, 2019. In the 2nd image, I clicked "optimize" on the Harmonic box and got a more nuanced red curve. It indicates that you should exit before the start of the NY session on Friday. I always feel Friday is the wild card. Price may or may not follow the prediction, especially for the NY session.. it is best to use regular TA at that point. The third image was data loaded into TS ending Sept 20, 2019, to see what the prediction would be for the following...
{quote} Nice Going... I see you were coding OmChi back in 2016.... impressive!
Ignored
omChi was recently (finally) re-designed (and renamed to chiOmEA), as per very old plan. it is strictly manual helper (user determines the trading direction - buy or sell), trade opening is managed by ea, again, with users input. many not useful code was removed.
i have found nice entry tactic, generally in most cases there should be max 2 wrong entries (1-2-3 technique), after that - follow the white rabbit, sorry, follow the price on daily candle. lol.
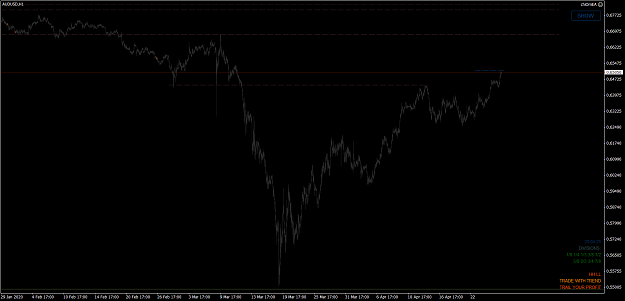
it has option to show/hide chart object, show/hide trendlines - main point here being clear chart, spaghetti-less...
semi-clean:
Attached Image (click to enlarge)
cluttered:
Attached Image (click to enlarge)
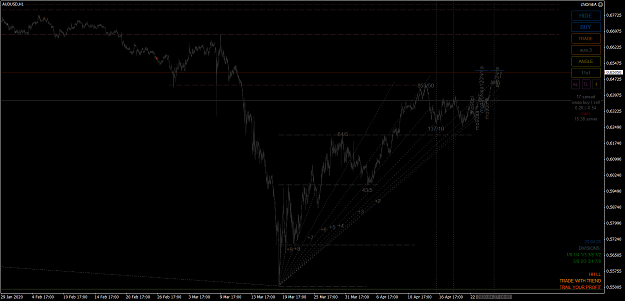
here you can see (quasi-)'gann' angles as trendlines (tls; gray color) - the price has been found to react to them, but, currently, it is still in testing phase. angles were 'derived' from first 3 'angles/tls' (counting from left side), then i used simple arithmetic to find next one. angle 'drawing' is implemented in chiOmEA.
the red-ish (top) lines are next target(s), again, simple arithmetic used, also in testing phase, also implemented in chiOmEA (i call it 'percent').