Greetings everyone,
Just posting some chart work, looking forward to any criticisms
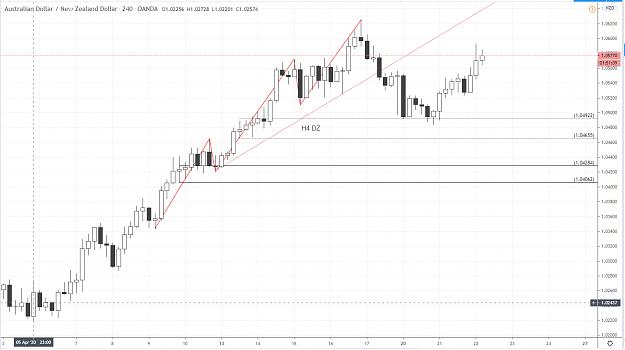
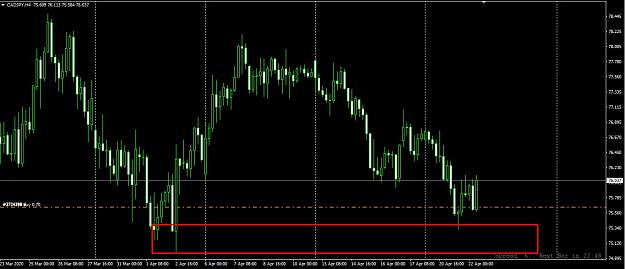
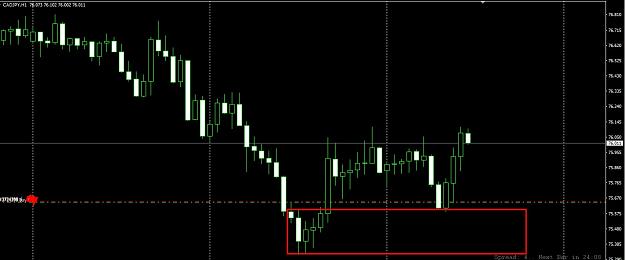
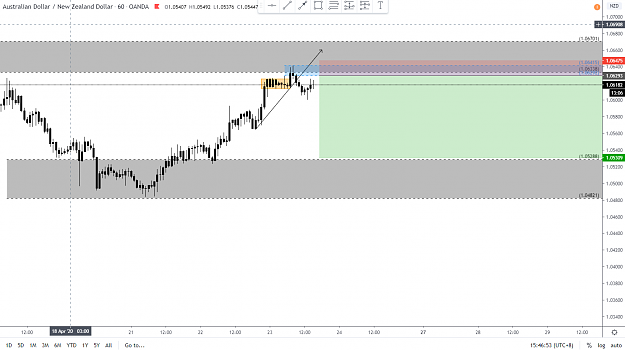
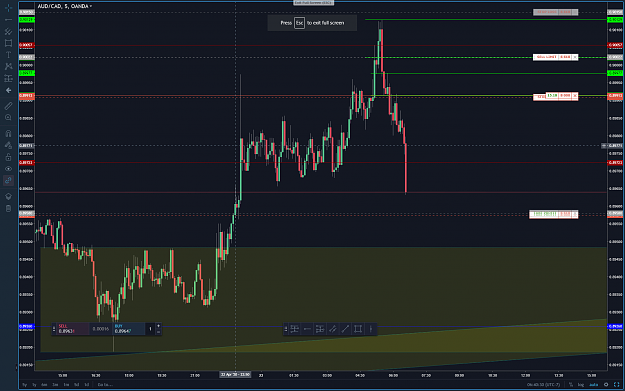
The pair is AUDNZD .
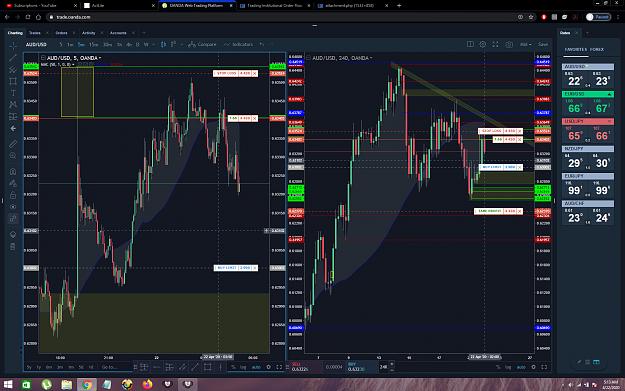
The timeframes I use are the Daily, 4Hr, 1Hr and 15mins for the lowest.
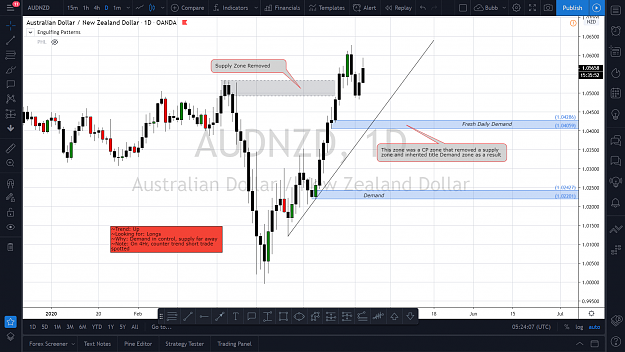
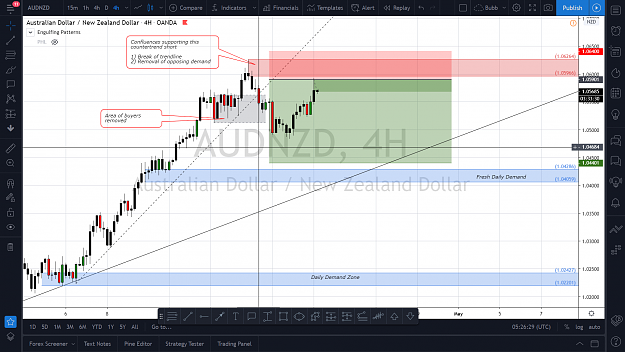
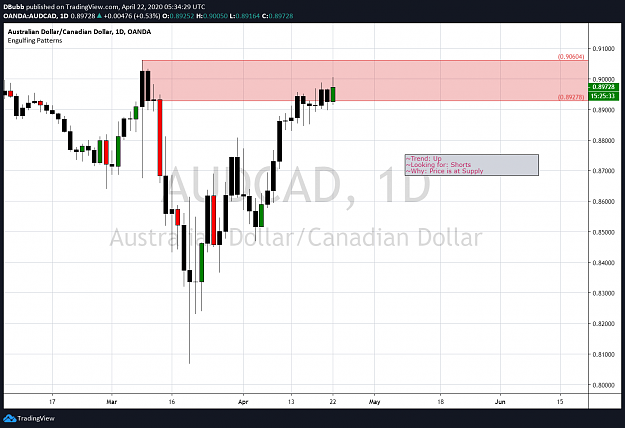
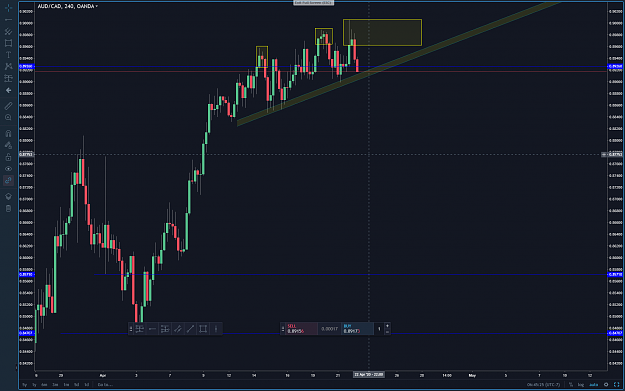
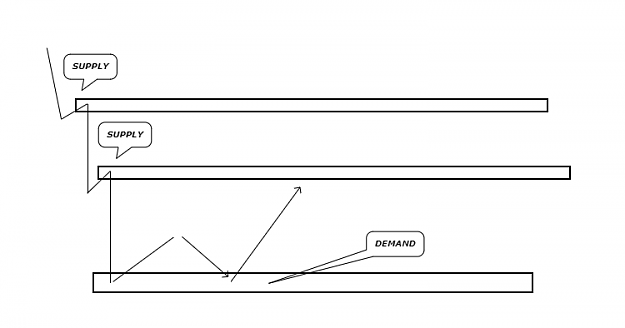
The main trend of the pair is UP and this is a counter-trend opportunity I saw to go short.
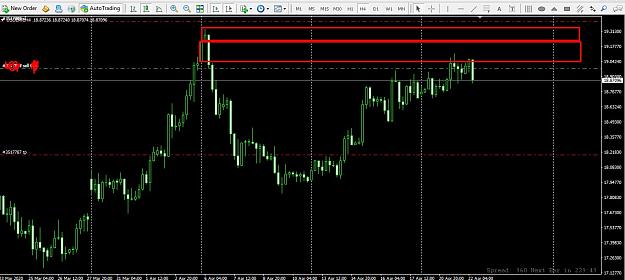
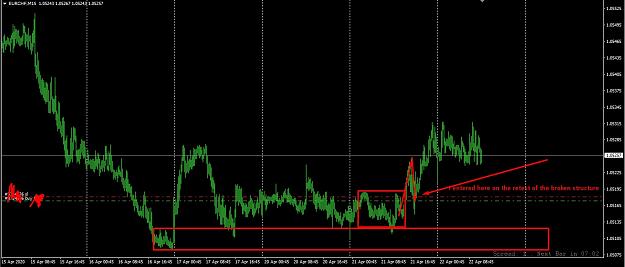
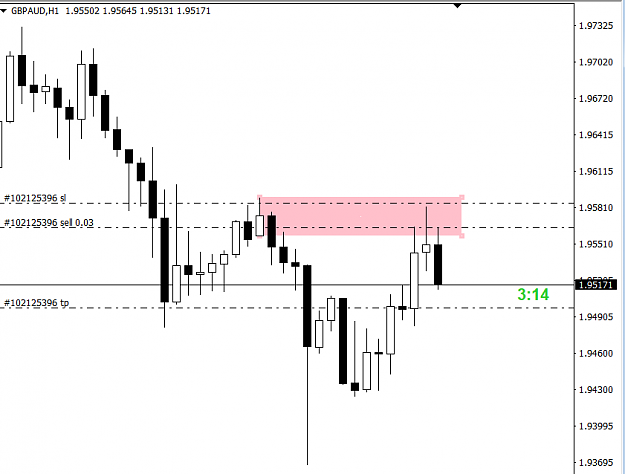
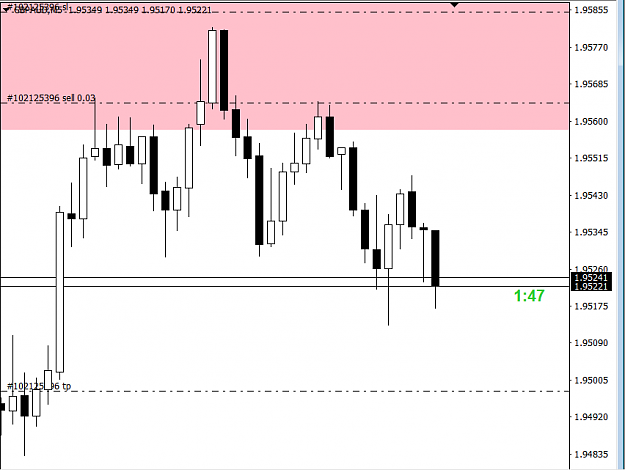
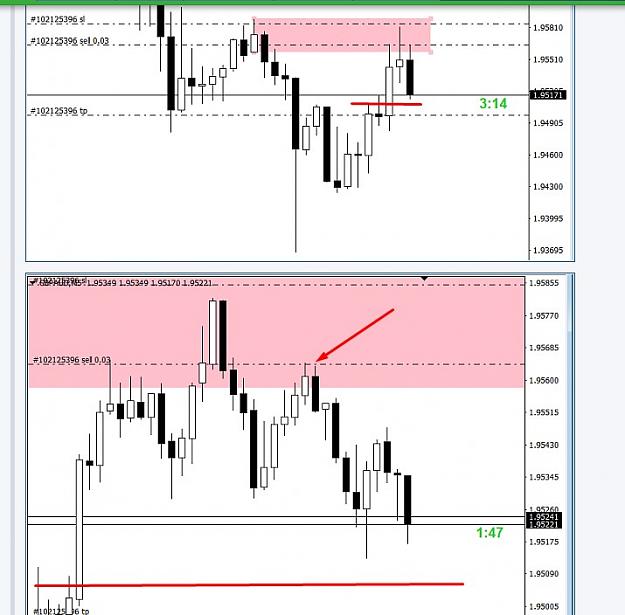
Although the trade looks active on my analysis, the long wick that penetrated there did not go far enough and cover my spread so i'm not in this trade at the moment.
Will update everyone with how it goes.
D.B
Just posting some chart work, looking forward to any criticisms
The pair is AUDNZD .
The timeframes I use are the Daily, 4Hr, 1Hr and 15mins for the lowest.
Attached Image (click to enlarge)
Attached Image (click to enlarge)
The main trend of the pair is UP and this is a counter-trend opportunity I saw to go short.
Although the trade looks active on my analysis, the long wick that penetrated there did not go far enough and cover my spread so i'm not in this trade at the moment.
Will update everyone with how it goes.
D.B
1