Many thanks for opening thread and usefull discussion. I wish all the best and good result using this method.
To trade channel is new for me and I have to exercise a little bit .
.
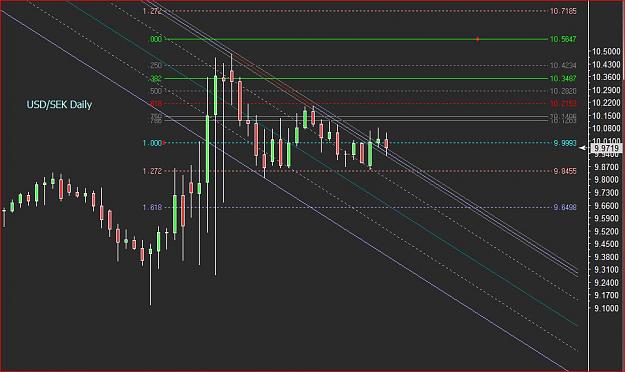
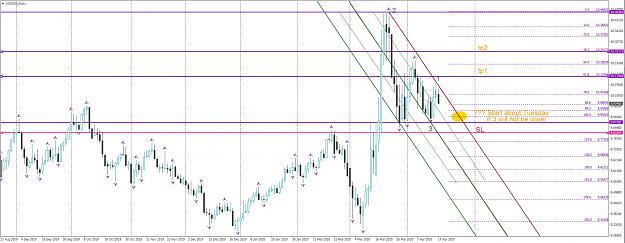
I will have a look for USDSEK long, daily, lets see what market is doing next days.
Critical comments are welcome.
To trade channel is new for me and I have to exercise a little bit
I will have a look for USDSEK long, daily, lets see what market is doing next days.
Critical comments are welcome.
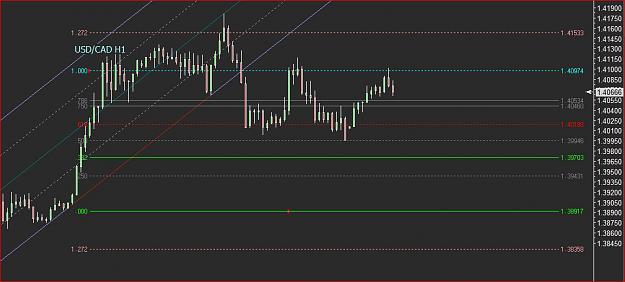
Attached Image (click to enlarge)
1