• Home
  • Forums
  • Trades
  • News
  • Calendar
  • Market
  • Brokers
  • Login
  • Join
  • User/Email: Password:
  • 7:43am
Menu
  • Forums
  • Trades
  • News
  • Calendar
  • Market
  • Brokers
  • Login
  • Join
  • 7:43am
Sister Sites
  • Metals Mine
  • Energy EXCH
  • Crypto Craft

Options

Bookmark Thread

First Page First Unread Last Page Last Post

Print Thread

Similar Threads

I will code your scalping EAs for no charge 36 replies

I will code your pivot EAs for no charge 18 replies

EAs and indicators relating to moutaki... 22 replies

InterbankFX has loaded its MT4 platform with custom EAs, indicators and scripts 1 reply

Need help to code EAs for MT4 and MT5 2 replies

  • Platform Tech
  • /
  • Reply to Thread
  • Subscribe
  • 35,943
Attachments: I will code your EAs and Indicators for no charge
Exit Attachments

I will code your EAs and Indicators for no charge

  • Last Post
  •  
  • 1 16581659Page 166016611662 2617
  • 1 Page 1660 2617
  •  
  • Post #33,181
  • Quote
  • Mar 20, 2020 6:36am Mar 20, 2020 6:36am
  •  mahi.su
  • Joined Sep 2015 | Status: Member | 8 Posts
Can somebody please modify the below EA, it is based on Half trend indicator. The EA should open orders according to the amplitude value of Half trend indicator but it is not opening. Please add functionality to close the current open order and open reverse trade whenever an opposite signal appears.Thank you very much
Attached Files
File Type: mq4 halftrend-1.mq4   6 KB | 126 downloads
File Type: mq4 Sly_Fox_Half-Trend_Rider.mq4   32 KB | 161 downloads
 
 
  • Post #33,182
  • Quote
  • Mar 20, 2020 6:38am Mar 20, 2020 6:38am
  •  slb
  • | Joined Nov 2019 | Status: Member | 1,121 Posts
Quoting NickBixy
Disliked
{quote} here another one {file}
Ignored
Thank you
 
 
  • Post #33,183
  • Quote
  • Edited Mar 23, 2020 4:34pm Mar 20, 2020 7:13am | Edited Mar 23, 2020 4:34pm
  •  walvekarraje
  • Joined Feb 2019 | Status: Member | 205 Posts
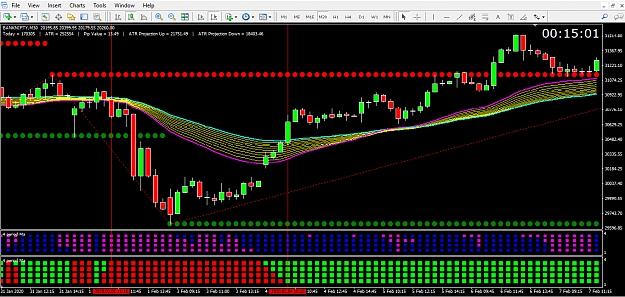
this is a very useful indicator by respected mrtools, especially for traders using multiple moving averages.
{ information deleted by staff, per membership policy } . he posted mlq file in the forum

subsequently he himself made few corrections, fixed bugs and posted an ex4 file.
{ information deleted by staff, per membership policy }

will somebody create alerts, arrows and push notifications when all the moving averages display the same colour for the first time?

mntiwana sir, you have also posted a version 2.1 here... { information deleted by staff, per membership policy }

the version 1.1 is the best and very user friendly but i dont have its mlq file.
as you can see this indicator can pinpoint exactly when to enter a trade.( marked by red vertical lines)
Attached Image (click to enlarge)
Click to Enlarge

Name: request 1.png
Size: 50 KB
Attached Files
File Type: mq4 Alex5757000_MFTMA1.0.mq4   22 KB | 211 downloads
File Type: ex4 Alex5757000_MFTMA1.1.ex4   32 KB | 168 downloads
 
 
  • Post #33,184
  • Quote
  • Mar 20, 2020 8:20am Mar 20, 2020 8:20am
  •  yako47
  • | Joined Apr 2017 | Status: Member | 60 Posts
Quoting BlueRain
Disliked
{quote} Try this one if it works for you. {file}
Ignored
it's a good one thnks for ur help
 
 
  • Post #33,185
  • Quote
  • Mar 20, 2020 11:40am Mar 20, 2020 11:40am
  •  valdecchio
  • Joined Jul 2013 | Status: Member | 171 Posts
Hello to all !!!
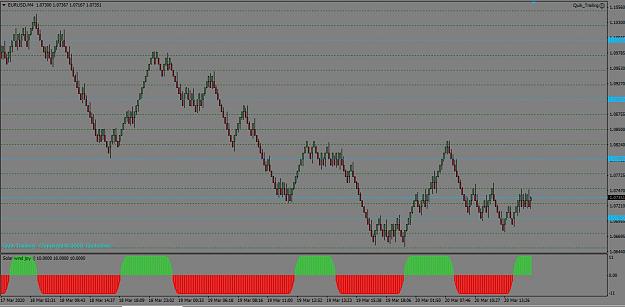
I would like to kindly ask, if anyone can KINDLY, add ALL the warnings to this indicator: email, push / mobile, sound, message in window.
thank you very much in advance.


Attached Image (click to enlarge)
Click to Enlarge

Name: solar.jpg
Size: 220 KB

Attached File
File Type: ex4 Solar Winds joy - histo (no repaint with alert).ex4   17 KB | 165 downloads

Attached File
File Type: mq4 Solar Winds joy - histo (no repaint with alert).mq4   5 KB | 237 downloads
1
 
  • Post #33,186
  • Quote
  • Mar 20, 2020 3:27pm Mar 20, 2020 3:27pm
  •  T4Trade
  • Joined Sep 2017 | Status: Trend Following,Price Action,Grid | 1,949 Posts
do we have any indicator that shows how many pips are in loss or profit of a present trade? please share thanks!
 
 
  • Post #33,187
  • Quote
  • Mar 20, 2020 3:30pm Mar 20, 2020 3:30pm
  •  Wevertonh
  • | Joined Mar 2020 | Status: Junior Member | 5 Posts
Can someone please help me? I have a nice indicator, but it shows up too late, can you make it shows earlier please??
Also, how can i convert ex4 to mql4?
Indicator is below attached
Attached File
File Type: mq4 Star 1.mq4   2 KB | 130 downloads
 
 
  • Post #33,188
  • Quote
  • Mar 20, 2020 3:38pm Mar 20, 2020 3:38pm
  •  NickBixy
  • Joined Apr 2018 | Status: Member | 715 Posts
Quoting T4Trade
Disliked
do we have any indicator that shows how many pips are in loss or profit of a present trade? please share thanks!
Ignored
https://www.mql5.com/ru/code/18334
The Happiness of your life depends on the quality of your thoughts
 
1
  • Post #33,189
  • Quote
  • Mar 20, 2020 3:38pm Mar 20, 2020 3:38pm
  •  psb
  • | Joined Oct 2015 | Status: Junior Member | 4 Posts
Quoting jesing
Disliked
{quote} Dear michaellobry, your requirements EA is done...!!! it's my 1st mt4 Coding...i hope you like it, INPUT LOT SIZE, TAKE PROFIT, STOP LOSS, ORDER GAP ( FOR BUYSTOP,SELLSTOP,BUYLIMIT & SELLLIMIT) with MAGIC NUMBER sorry i don't got your last SOUND ALARM, so its not complete bcoz i don't understand what you want, find Attached file, ENJOY, Best of Luck, HAPPY TRADING - jesing sumesara {file} {image}
Ignored
Hi,

Thank you for this nice order placement with one click, it would be possible to add two extra buttons - CLOSE and CLOSE ALL?

Regards,
 
 
  • Post #33,190
  • Quote
  • Mar 20, 2020 5:11pm Mar 20, 2020 5:11pm
  •  BlueRain
  • Joined Sep 2019 | Status: Member | 844 Posts
Quoting valdecchio
Disliked
Hello to all !!! I would like to kindly ask, if anyone can KINDLY, add ALL the warnings to this indicator: email, push / mobile, sound, message in window. thank you very much in advance. {image} {file} {file}
Ignored
Added a couple of lines to existing code.
Try out..
Attached File
File Type: mq4 Solar Winds joy - histo (no repaint with alert).mq4   6 KB | 223 downloads
 
 
  • Post #33,191
  • Quote
  • Mar 20, 2020 8:28pm Mar 20, 2020 8:28pm
  •  livingsoul99
  • | Joined Jul 2019 | Status: Member | 58 Posts
Quoting hanover
Disliked
{quote} Try the attached. It was an easy enough job for me to modify the existing dashboard to show fractal swing highs and lows. The candle numbers work like this: 0 = the currently forming candle 1 = the most recently completed candle (just to the left of candle 0) 2 = the candle to the immediate left of candle 1 3 = the candle to the immediate left of candle 2 and so on. The two critical parameters are: NumberOfCandles: this is the number of candles on each side of the 'master' candle that are tested. If the master candle has the highest high...
Ignored
Greetings noble trader Hanover,

Oh my God, you are a genius. Being a master coder gives you an extra edge, and you will see what I'm saying
I'm an artist, and I see things and read in between the lines very well, so I see things from an intricate standpoint being an artist.

When you said master candle and possibly repainting, you helped me to reconfirm something that I had been noticing about the market, and that is: WHY THE ARROWS KEEP REPAINTING?

And Hanover please, please, please come back,
I think I discovered a missing link that has been overlooked . . . but its right there in our faces.
I think you will be able to help put it in perspective, with a dashboard,
I use certain indicators and they help see what I'm about to explain, but I never had no one with the experience to talk to, like yourself, and just found out about forex factory recently, but I think you can code the best EA or dashboard to hit it on the nail!!! I HONESTLY think I discovered which indicators to use for the dashboard or EA, to confirm entries and exists . . . and if you think it's worth analyzing, then we can fine tune it to get the best results.

When you refer to the master candle and possible repainting, you are referring to price seeking the main reversal point [the official lowest low <<or>> official highest high before each major reversal happens / let's say for example aka: the high of day [HOD] -or- low of the day [LOD] which is just one I discovered.

I think I figured it out some time a few months back and I think I figured out why it's repainting (and why it always happens with arrow based indicators!!!)

I think I discovered why it's repainting.

I really want to say that the true reason repainting happens is because price is simply seeking to REACH the official high <or either> REACH the official low, and it won't stop repainting until that official high or low it is FINALLY REACHED!!!!!!

KEY NOTE: ITS 8 DIFFERENT HIGHS AND LOWS, FROM LONGEST HIGH OR LOW TO SHORTEST HIGH OR LOW BASED UPON:
THE MONTHLY BEING THE LONGEST <<AND>> THE 5 MINUTE BEING THE SHORTEST.

QUES:? So, I wondered to myself how do we determine where that THE FINAL official high or THE FINAL official low is really located?
ANS: I then noticed that its several key highs and lows to look for, and it's relative to which high or low are we talking about, and it's based on which time frame??? Because each time frame has its own High and Low INTERLOCKING and OVERLAPPING each other!!!
1). The MONTHLY high or MONTHLY low
2). The WEEKLY high or WEEKLY low
3). The DAILY high or DAILY low
4). The 4HOUR high or 4HOUR low
5). The 1HOUR high or 1HOUR low
6). The 30MINUTE high or 30MINUTE low
7). The 15MINUTE high or 15MINUTE low
8). The 5MINUTE high or 5MINUTE LOW
9). THE 1MINUTE HIGH OR 1MINUTE LOW does not really count because each individual candle on the minute time frame is the 1minute high and 1minute low, so it just hugs each candle non stop!!!

However, THE 1MINUTE CHART is the real time that all higher time frames reflect based on candle stick addition, So the 1MINUTE CHART is the real chart for the first move of all moves, and each higher time frame is just multiples of the 1 minute.
5minute chart >>> a 5 minute candle = has 5 candles in it, and each one is 1 minute long
15minute chart >>> a 15 minute candle = has 15 candles in it, and each one is 1 minute long
30minute chart >>> a 30 minute candle = has 30 candles in it, and each one is 30 minutes long
etc. etc. >>>> on up to monthly [ so its: 5 / 15 / 30 / 60 (H1) / 240 (H4) / 1440 (D1) / 7200 (WK) / 28800 (MN) ]
THE ONE MINUTE DOES NOT HAVE A WIDE ENOUGH HIGH OR LOW CHANNEL, SO IT JUST HUGS EACH CANDLE, SO YOU HAVE TO ATTACH A HIGH AND LOW CHANNEL BASED ON THE 5 MINUTE TIME FRAME OR HIGHER WHEN USING THE 1 MINUTE CHART TO TRADE.

So it really depends on which time frame we are looking for a high <or> low at.

The higher the time frame, then the wider the HIGH or LOW swings are!!! But guess what?: PRICE always stops at each one separately!!!
I discovered each time frame has its own individual high or low, and they all interlock!!!!!

So, its repainting until it reaches each time frame's high and low INDIVIDUALLY. . . thus you get the higher high and higher low, <<or>> the lower high and lower low TRADING PRINCIPLE, because those are highs and lows within highs and lows!!!!

QUEST: So, what is the MASTER -or- final official high -or- final official low [SIGNALING EACH MAJOR REVERSAL]?
ANS: Its BASED UPON actually 8 different highs <&> 8 different lows, that are ranging from the longest to the shortest, and that's based on each time frame INDIVIDUALLYall interlocking on top of each other: 5 / 15 / 30 / H1 / H4 / D1 / WK / MN.

QUEST: So which timeframe do we go with?
ANS: THE 1ST IS WHEN THE MONTHLY HIGH AND LOW is hit [position trading]
THE 2ND IS WHEN THE WEEKLY HIGH AND LOW is hit [position trading]
THE 3RD IS WHEN THE DAILY HIGH AND LOW is hit [intra day trading]
THE 4TH IS WHEN THE 4HOUR HIGH AND LOW is hit [intra day trading]
THE 5TH IS WHEN THE 1HOUR HIGH AND LOW is hit [intra day trading]
THE 6TH IS FOR SCALPING USING EITHER THE 5m / 15m / 30m HIGH AND LOW of each individual
time frame, which makes orders short and sweet, in and out.

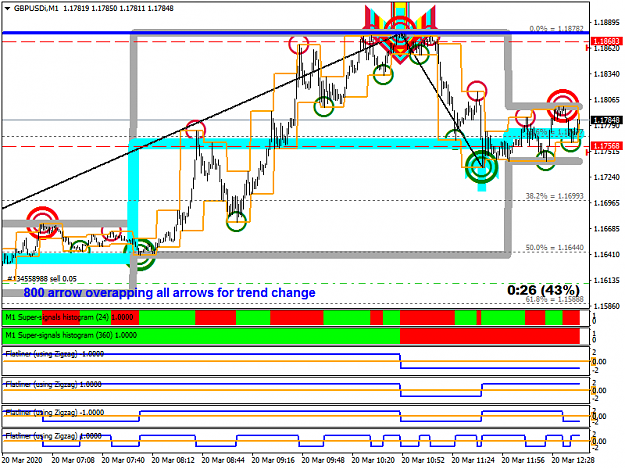
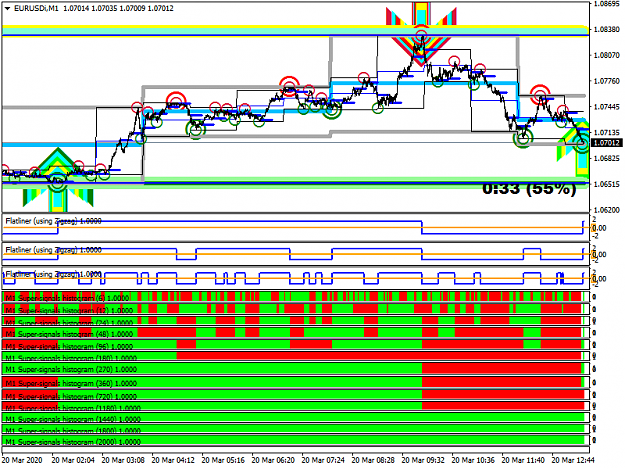
I uploaded a picture of my screen below, but if we can get together and code it out. You'll see the big arrows, those are the ones I was thinking of making a dashboard to catch those. They always paint on the 4 hour high or low, and signal big moves.

I discovered the 4 hour high and low is the best one to go with intra day, and price ALWAYS reverses at the 4 hour high and low ...but sometimes with a slight trick to it / which happens if the price has to hit the daily high and daily low overlapping the the 4 hour hi or lo, and if so, then the arrows repaint due to aiming to reach the present daily high or low target
Key Note: That's usually if the daily high and low hasn't been hit yet . . . thus it still has to be hit, so arrows will repaint because it's still aiming for the final HOD or LOD. I notice that the Asian Session high and low is usually not the final HOD nor LOD when this happens.

Also, I noticed how each session has it's own session's high and low which that's actually reflected by using the 4 hour high and low channel to see it better. Therefore, I can look for a new "4 hour high and low" every 4 hours, but I make sure that the "1 hour high and low channel" MUST BE going in the same direction as the "4 hour high and low channel." OR ELSE IT'S A RETRACEMENT WHEN THE 1 HR GOES AGAINST THE 4 HR.

Another real tricky move is what I called the "Yesterday's high and low <in comparison to> Today's high and low TIGHT SQUEEZE MOVE, but I use the 50% daily pivot as my clue." Its harder to explain but on the screen, it's like there it is!!! That SQUEEZE MOVE generally happens around tuesday into wednsday because it's a result of the market trending for several days, as it's aiming to hit the present weekly high <or> weekly low. I also use the daily 50% pivot when its a weekly up trend, and I notice how price first retraces to the LOD in the Asia Session [right before the london BO] nearly every day when its an uptrend for that week, <<<and vice versa >> price retraces back up to the HOD in the Asia Session in a weekly down trend...

Hanover, please get back with me.
I think its a blessing we crossed paths.

I just never could get anyone to build with that had way more experience to say: yeh, that's true, that does make sense because of x, y, z, etc. etc. So, I've been trying to figure this all out over the last 9 months, and learning week to week, month to month. However, Hanover, please correct me, if I stated something incorrect or my analysis is off a little or a lot. I'm always open to constructive or productive criticism.

I have a gift for putting things together, because I'm an artist and song writer, so I my gifts make me perceptive to put together some interesting templates . . . but I began to realize indicators are really reflecting highs and lows, so the only indicators really truly needed are high and low principle based indicators, because that's where the market always reverses...but the underling key is they overlap each other. So, you really don't see that happen without the proper high low indicator, and if you don't realize they overlap each other, you won't get the best use out of it.

Also, one last note, the market always ranges if the high and low have been hit. If its a very tight range it will retest it, and appear to hit it twice. But usually it's not, and the range is because it hit both the high and low of that time frame, and it just ranges the rest of the way.
It can range in the beginning, middle, or end, depending on how soon the high or low is hit for that time frame.
I discovered that this range actually happens on each time frame individually, which shows how time frames are tightly interwoven thru candles stick addition. The key is timing and catching when price hits the high or low for the first time...

***Key note: TO ANY TRADER THAT HAPPENS TO READ THIS, PLEASE BACK TEST. THIS IS JUST MY OBSERVATION, PLEASE TEST IT. IM NOT A FINANCIAL ADVISOR IN THE MARKET. I JUST PAY ATTENTION TO DETAILS. TRADING IS ALWAYS RISKY. WE ALL TRADE AT OUR OWN RISK. TRADE AT YOUR OWN RISK, AND TRADE IN A DEMO ACCOUNT FIRST AND WIN REPEATEDLY WITH VERY FEW LOSES BEFORE GOING LIVE. RISK MANAGEMENT IS ALWAYS KEY. PRACTICE. PRACTICE. PRACTICE

Below is a couple of images of the system I use on the 1 minute to show some of what I'm saying, but its a whole lot of different period settings involved. . . and I also compare the 1 minute / 1 hr / and 4 hr charts simultaneously. Its very profitable if I catch the beginning of the trend with all the highs and lows overlapping.

So please Hanover, can you message me, whenever you get back online and see this message.
Peace my friend, noble Hanover, be safe until we build again....And thank you again
Attached Images (click to enlarge)
Click to Enlarge

Name: GBPUSDiM1 livingsoul99.png
Size: 51 KB Click to Enlarge

Name: EURUSDiM1 living soul.png
Size: 54 KB
 
 
  • Post #33,192
  • Quote
  • Edited Mar 21, 2020 4:21am Mar 20, 2020 9:34pm | Edited Mar 21, 2020 4:21am
  •  josi
  • Joined Aug 2019 | Status: Member | 438 Posts
I am looking for an indicator that colours the background of my chart window (directional bias):
Of course it would be best if it had many MA-options (SMA; EMA; LWMA; HULL; etc).
This is the functionality I'm looking for:
1. MA slope up: colour A; MA slope down: colour B
2. MA1<MA2: colour A; MA1>MA2: colour B
3. price closes above MA: colour A; price closes below MA: colour B
I'd be grateful for any help.
 
 
  • Post #33,193
  • Quote
  • Mar 20, 2020 10:04pm Mar 20, 2020 10:04pm
  •  BlueRain
  • Joined Sep 2019 | Status: Member | 844 Posts
Quoting livingsoul99
Disliked
{quote} WHY THE ARROWS KEEP REPAINTING?
Ignored
If your indicator has something to do with Current Candle's Price like High, Low, Close/current price, it will repaint.

Only case it won't repaint is if you are using Open price of current candle which is already happened and written in the rock.

Except Open price for current candle, other price points like Current Candle's High, Low, Close are not final yet until this candle is closed.
In the case Multi-Time Frame, it is even worse as you are dealing with moving targets for many current candles. All of those will be repainted.


That is trade off for using Current Candle.. you want latest Price info in your indicator to have in your indicator but as its result, you get repainting indicators.
 
 
  • Post #33,194
  • Quote
  • Mar 20, 2020 10:48pm Mar 20, 2020 10:48pm
  •  livingsoul99
  • | Joined Jul 2019 | Status: Member | 58 Posts
Quoting BlueRain
Disliked
{quote} If your indicator has something to do with Current Candle's Price like High, Low, Close/current price, it will repaint. Only case it won't repaint is if you are using Open price of current candle which is already happened and written in the rock. Except Open price for current candle, other price points like Current Candle's High, Low, Close are not final yet until this candle is closed. In the case Multi-Time Frame, it is even worse as you are dealing with moving targets for many current candles. All of those will be repainted. That is trade...
Ignored
Thank you Blue Rain

I appreciate you pointing that out for me.

It helped to clear up the open, close, high, low candle concept that I noticed using EA BUILDER.

The arrow indicator I used must not be set to open because it definitely will repaint when a previous highest high or lowest low is broken, which I know how to tell if that will happen.

I also noticed how it repaints especially around every 4hours on the one minute.

I noticed by using a daily line indicator that its only 6 candles on the 4 hour chart that sum up each new day. So, each 4hr candle is comprised of all the lesser time frames based upon candlestick addition, so an arrow on the 4hour is a stronger move to help determine trend direction.

So, when I see an arrow paint on the 4hr, I noticed that arrow shows a major turning point signaling that the market is going in that direction, and then I drop down to the one minute to see where the elliot waves are to avoid getting in on the retracements.

I noticed the market moves within 6 sets of 4hr highs and lows. You can sum up each session around 8 hours each, which matches how the market moves to new highs and lows every 4hours.

Studying candle stick addition, helped me realize how each time frame is still the 1 minute chart, but the higher time frame you just zoom in closer, but price is still based on the 1 minute regardless of which higher time frame you use.

The 1 minute chart is really best used to zoom out as far as you can, in order to see all the elliot wave type patterns.
But some indicators won't help you see it, like moving averages. Moving averages lines aren't designed to help see it that way.

So, I began to realize that repainting is not that bad, especially after I started learning how to tell when the arrows will repaint.
Based on your wisdom and insight, it sounds like you code. Do you code also using meta editor?

Thanks you for your insight.
Livingsoul99
 
 
  • Post #33,195
  • Quote
  • Mar 21, 2020 12:06am Mar 21, 2020 12:06am
  •  BlueRain
  • Joined Sep 2019 | Status: Member | 844 Posts
Quoting livingsoul99
Disliked
{quote} Livingsoul99
Ignored
Glad that you are getting some idea on how Candles works.
Higher TF candles are basically summed up of lower candles.

Yes.. I do code on Meta Editor but just beginner level yet.
Not even close to those master level programmers like Hanover.
 
 
  • Post #33,196
  • Quote
  • Mar 21, 2020 3:27am Mar 21, 2020 3:27am
  •  haruteri
  • | Joined May 2018 | Status: Member | 12 Posts
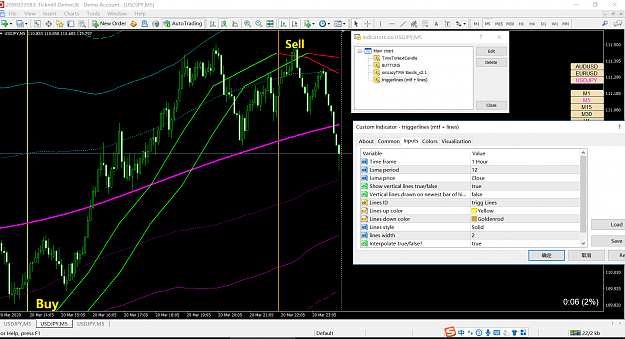
Dear coders,

Could you pls turn the attached indicators into an EA?

It should place buy orders while only triggerlines up and price under the central line of smTMA Bands,
and place sell orders while only triggerlines down and price above the central line of smTMA Bands.

And it should have:
Trailing stop,
Breakeven,
StopLoss,
etc.

TF: Any
Pairs: Any

Thanks in advance.

B.R.,
Haruteri
Attached Image (click to enlarge)
Click to Enlarge

Name: 01.png
Size: 158 KB
Attached Files
File Type: ex4 triggerlines (mtf + lines).ex4   49 KB | 241 downloads
File Type: ex4 smLazyTMA Bands_v2.1.ex4   21 KB | 177 downloads
File Type: mq4 smLazyTMA Bands_v2.1.mq4   9 KB | 178 downloads
File Type: tpl 01.tpl   209 KB | 129 downloads
 
 
  • Post #33,197
  • Quote
  • Mar 21, 2020 1:05pm Mar 21, 2020 1:05pm
  •  newark18
  • | Joined Sep 2010 | Status: Member | 371 Posts
I am looking for an EA that will do the following:

1. After I manually place an order (ie, buy), I would like to place a horizontal trendline on the chart. This horizontal line can be above or below price.
2. If I buy and place line below the price, this line represents something similar to a stoploss. But the trade closes (not by touching the line but only) if the candle (on the current chart) closes under the line.
3. If I sell and place the line above the current price, again the trade would close only if the candle closed above the line.

I am willing to pay for this. Please PM me. Thanks!
 
 
  • Post #33,198
  • Quote
  • Mar 21, 2020 2:18pm Mar 21, 2020 2:18pm
  •  valdecchio
  • Joined Jul 2013 | Status: Member | 171 Posts
Quoting BlueRain
Disliked
{quote} Added a couple of lines to existing code. Try out.. {file}
Ignored
thank you very much man !!! very kind... i've load on renko charts now, i'll let you know on monday..
thank you really.. again !
 
 
  • Post #33,199
  • Quote
  • Mar 21, 2020 3:04pm Mar 21, 2020 3:04pm
  •  Kafin
  • | Joined Mar 2013 | Status: Member | 99 Posts
Quoting japfx
Disliked
{quote} thanks for the response , i do not want EA for this , i needed an indicator LRC within the last 2 sessions and not extend further ... the indicator only reset at end of session. i am sorry, for now , i don't have any knowledge about coding .
Ignored
Adjusting and extending the Regression lines the way you are doing will require much more programming as Hanover suggested. By the time all those ones are created, we will be having all the details that the EA will need to take a Trade.

Anyway, I don't really understand your system, and could not perform a review to determine if I should put in more coding-efforts.
The attached code is an EA, you can use the tester to complete your review.

If the review is as great as you earlier mentioned, I will be interested in completing the EA.
Please note that I will need to see the idea/system tested on at-least 500 Candles (hopefully more in this case) to fully understand the system's conditions, and also estimate how much time I should allocate to the effort.
Attached Files
File Type: ex4 LRC1.ex4   8 KB | 121 downloads
File Type: mq4 LRC1.mq4   2 KB | 169 downloads
 
 
  • Post #33,200
  • Quote
  • Mar 21, 2020 3:14pm Mar 21, 2020 3:14pm
  •  Kafin
  • | Joined Mar 2013 | Status: Member | 99 Posts
Quoting newark18
Disliked
I am looking for an EA that will do the following: 1. After I manually place an order (ie, buy), I would like to place a horizontal trendline on the chart. This horizontal line can be above or below price. 2. If I buy and place line below the price, this line represents something similar to a stoploss. But the trade closes (not by touching the line but only) if the candle (on the current chart) closes under the line. 3. If I sell and place the line above the current price, again the trade would close only if the candle closed above the line. I am...
Ignored
So you want the EA to find/read the line and use its value to close your trade?

How do you draw the line?
Do you only have one line on the chart at a time?
Do you have more than one trade on the chart at a time?
 
 
  • Platform Tech
  • /
  • I will code your EAs and Indicators for no charge
  • Reply to Thread
    • 1 16581659Page 166016611662 2617
    • 1 Page 1660 2617
10 traders viewing now, 4 are members:
kennyxox
,
littlebear8
,
Invisible
,
demon83
  • More
Top of Page
Forex Factory Blog Updated: Alerting All Members
  • Facebook
  • Twitter
About FF
  • Mission
  • Products
  • User Guide
  • Media Kit
  • Blog
  • Contact
FF Products
  • Forums
  • Trades
  • Calendar
  • News
  • Market
  • Brokers
  • Trade Explorer
FF Website
  • Homepage
  • Search
  • Members
  • Report a Bug
Follow FF
  • Facebook
  • Twitter

FF Sister Sites:

  • Metals Mine
  • Energy EXCH
  • Crypto Craft

Forex Factory® is a brand of Fair Economy, Inc.

Terms of Service / ©2022