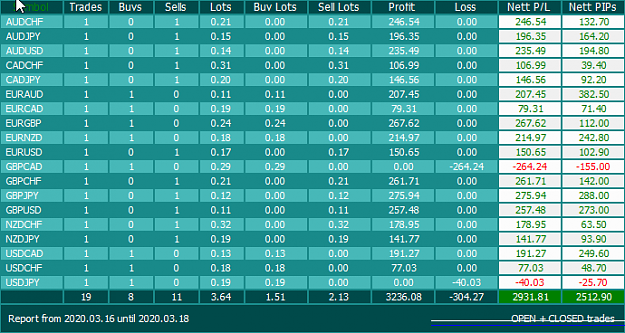
"Pips are vanity. Profit is sanity."
- #1,431
- Mar 18, 2020 12:09pm Mar 18, 2020 12:09pm
- Joined Jul 2011 | Status: Gold Again | 10,560 Posts
It takes a lot for me to IGNORE you, but you can try.
Simple Monthly System (see attached calculator) 48 replies
Excel simple risk calculator needed 10 replies
what if every free system is attached to a trading explorer? 28 replies
If it's such a great system, why isn't there a Trade Explorer attached? 261 replies
Simple Fx Calculator 1 reply
Disliked{quote} My GBPCAD hasn't broken the Low break at 15%. Nearly but not actually.Ignored
Disliked{quote} ah very nice, exactly the kind of patterns I was talking about, good stuff And yeah, inputting all data in excel is timeconsuming, but then you can do a lot more stuff with the data once you find new angles. Ofcourse the 'easiest' way to do this is to import tick or 1m data and let excel do all the analysis, but setting this up for a new strategy is still quite time consuming even with good excell skills, and this way you don't have the advantage of gaining new insights just from seeing hundreds of trades. For example normally when I research...Ignored
DislikedAttached is the Analysis EA with an update. I have added in the facility that if its run on a chart that is being analysed it will also draw all the Hi Lo Break lines as well. Makes it visual as well as a spreadsheet output. {file}Ignored
Disliked{quote} Yes optimal R:R calculations are endless and partly pointless, optimization will just lead to futile results, as is the case with nearly all optimization on past results. It's mainly just to get an indication; is it better to trade for long term gains, or are the breakouts usually short and then reverse. I mean who is to say an R:R of 1:.5 might not yield infinitely better results (just as an example). For example the main strategy I trade I use 1:10 TP's only, while it is theoretically also possible...Ignored
DislikedData looks nice, your just going to need a whole lot more. I would highly suggest adding in winning %, max R:R reached and such info in order to make it more 'workable' Also on a sidenote I don't really understand why people want to trade so many pairs, why not either pick the ones with lowest spread or the ones that perform the best. This seems to go far beyond the realm of diversification and far into the realm over overcomplication and overpaying for spread.Ignored
Disliked{quote} Sorry I said badly. In the csv in the LoBrk column I read whole numbers (4/5). What does it mean? I highlighted in green. {image}Ignored
Disliked{quote} It might be for testing purposes, or as I like to call it, GREED{image}
Ignored
Disliked{quote} I agree with everything you say 100%. I do what I can visually and longhand because I neither have the excel skills nor the EA capable enough to get all of these stats. I am also very bad at using the back tester. It's a good thing I believe in the backtester about 0.01%. The only thing it's good for is testing the functionality of an EA. Results and stats on a strategy/EA mean nothing.Ignored
Disliked{quote} Going like a steam train. I've already hit several profit targets. Next I think we need to find a way to have smarter TP. This is a bit crude. Not complaining a profit is always a profit.Ignored
Disliked{quote} This reminded me of something I was thinking while I was visually backtesting the 12 pairs. I very rarely seen any pairs go to 1:3 or 1:4 or 1:5 etc. Take these stats with a grain of salt though. It's only the past year.Ignored
Disliked{quote} I agree with everything you say 100%. I do what I can visually and longhand because I neither have the excel skills nor the EA capable enough to get all of these stats. I am also very bad at using the back tester. It's a good thing I believe in the backtester about 0.01%. The only thing it's good for is testing the functionality of an EA. Results and stats on a strategy/EA mean nothing.Ignored