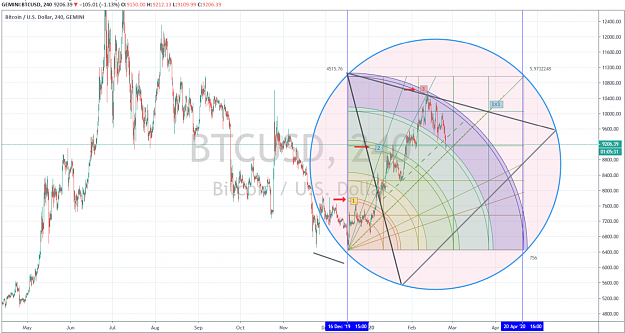
Quite a day for BitCoin. No real support at 1x1...blew right though it. Updated image with blown up insert. Extended RSI may stabilize selling pressure. Let it turn up first. Trying to pick bottoms usually produces sticky fingers ! S. {image}
Ignored
Imho rsi offers no help.
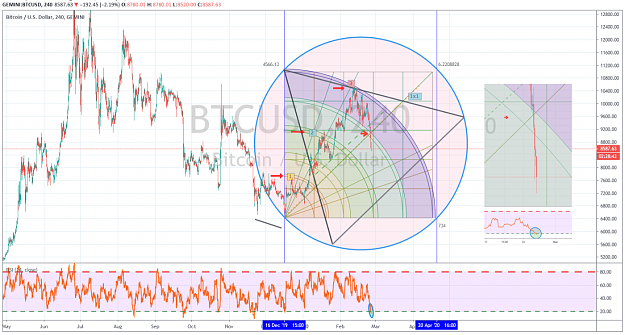
Support 8500 reached. The next part of the journey is to break 8200 for this fall to be valid bear, the next 300pips is vital. Failure means this fall presents buying opportunity for the bulls.
I see 6200 broken to eventually test the 3800 low later this year. This is the initial stage of this move. This is more a sell into rally rather than buy on dips.
{quote} Imho rsi offers no help. Support 8500 reached. The next part of the journey is to break 8200 for this fall to be valid bear, the next 300pips is vital. Failure means this fall presents buying opportunity for the bulls. I see 6200 broken to eventually test the 3800 low later this year. This is the initial stage of this move. This is more a sell into rally rather than buy on dips.
Ignored
Notice this 8500 level holds up the last 2 days of the week. Nothing has changed yet, the massive fall from Monday is still intact, the momentum is reduced considerably, still targeted to break 8200. Next week we will know if this fall continues or not with the current probability indicating yes. This changes in live market.
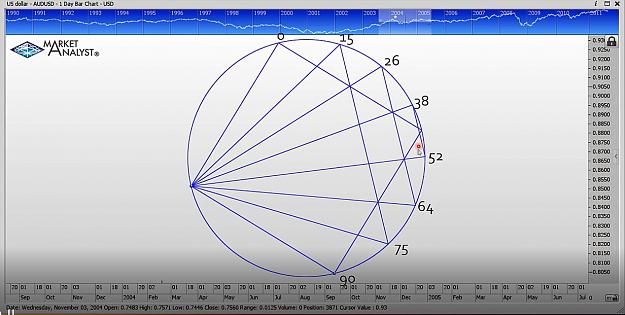
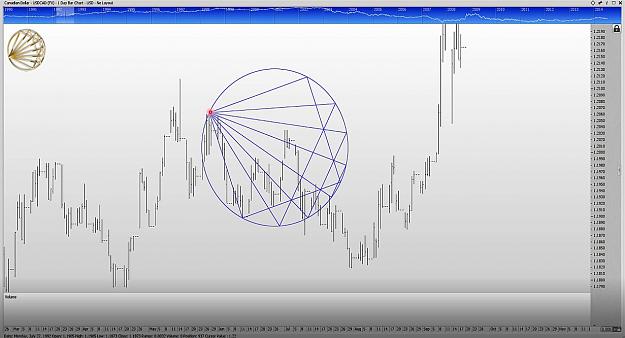
Moving on, let me explain a few things. Contained in the next pic is a Circle, a Tetrad, and a Triad(actually two) the 38 degree and the 52 degrees are the two best possible entry points.
Attached Image (click to enlarge)
Now notice the Bearish 52
Attached Image (click to enlarge)
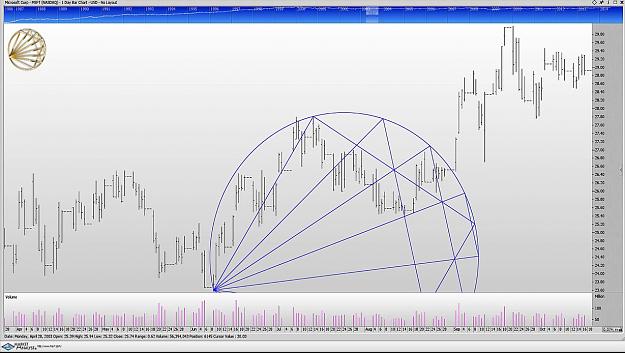
Now notice the Bullish 38
Attached Image (click to enlarge)
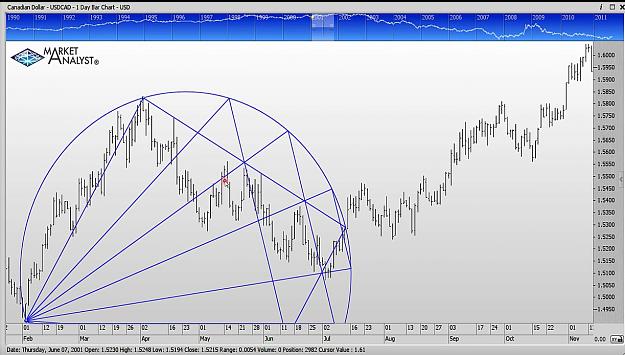
Once there is an Impulse wave starting at X to A, that opens the possibility of a trade. Also note: not every situation will become a valid trade. Now let's see as example a Bullish 52 TCG 52 TCG=Trend Continuation Gartley.
Attached Image (click to enlarge)
Let's keep in mind there is a ton of stuff to learn, and little by little it will fall into place. Be Patient.
You NEVER will be the person you could be, without pressure & discipline
Here you go folks, you need to place the file in the SCRIPTS directory of your MT4 folders . To use, navigate to the scripts folder and drag on to a chart and drag the trend line to you swing points , it will do the rest {image} {file}
Ignored
Hello my friend! Share the open source code for these scripts Circle Script v1.0.ex4
Michael Jenkins Angle Script v1.0.ex4
It is very necessary to write indicators! When you switch the timeframe, the scripts are disabled, you have to re-insert them on the graph!
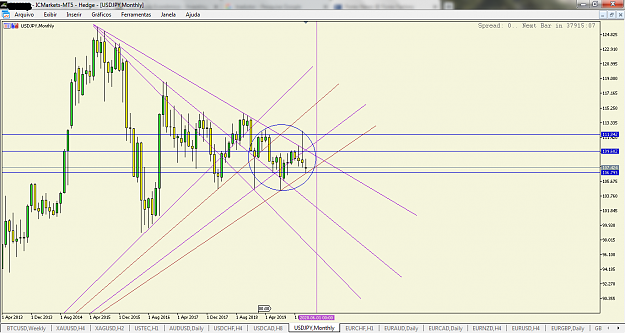
{quote} FUNDI In the example hereunder a) Enveloppes allow you most of the time to identify and classify the dominant(s) cycle(s) at work within Price Action b) The Underlying Trend is the Sum of ALL cycles whose period is greater than the longest period of the Envelope - here 256 Time Units. This includes the 25.920 years cycle ! Hurst called this Sum of Cycle Sigma L. The Underlying Trend shows the influence of Sigma L within Price Action Notice that in this specific case : The Dominant (visible) Cycles fuctuates up and down within the Enveloppe...
Ignored
Excellent.
Can you analyse similarly in last week'DAX performance.
Does it validates the pattern of January?
{quote} Hello my friend! Share the open source code for these scripts Circle Script v1.0.ex4 Michael Jenkins Angle Script v1.0.ex4 It is very necessary to write indicators! When you switch the timeframe, the scripts are disabled, you have to re-insert them on the graph!
Ignored
Author of the code doesn't want to share his code. Mentioned somewhere in thread.
Moving on, let me explain a few things. Contained in the next pic is a Circle, a Tetrad, and a Triad(actually two) the 38 degree and the 52 degrees are the two best possible entry points.{image} Now notice the Bearish 52{image} Now notice the Bullish 38{image} Once there is an Impulse wave starting at X to A, that opens the possibility of a trade. Also note: not every situation will become a valid trade. Now let's see as example a Bullish 52 TCG 52 TCG=Trend Continuation Gartley. {image} Let's keep in mind there is a ton of stuff to learn, and little...
Ignored
DiamondMiner, you are amazing! I read all posts, you are a diamond for all of us
I have removed the yellow watermarks from the Square the Range pdf. DM me if anyone needs it. Having read the book, I must say it's quite confusing because there's a million ways to do things and you have to keep trying and see what works for your instrument/charting software. Although the methods do seem to work it's a lot of effort to get it right. I have also read the Secret Angle and that one contains simpler methods. Currently I'm having much more success with the Secret Angle, even though Square the Range should be the superior system as it...
Ignored
Dear Majomember I am intersted in the Square the Range pdf. Can you write me please? My status don't permit writing you. Thanks
Using this neat Astrological tool website, https://horoscopes.astro-seek.com/br...roscope-online You can find when different heliocentric solar system bodies will align. Using London, England as the location. So, according the Cooley-Granville Book 1, with the conjunction of Mars & Jupiter, starting around March 18/19, 2020, markets will drop for several weeks while Mars and Jupiter are close together. Earth is the black circle with the X in it. {image}
Ignored
Uncanny.
Three months ago, in post #1016, on December 15, 2019, while stock market was flying high, Cooley-Granville predicted large market drop based on alignment of the planets.
Prediction was off by a couple days.https://www.forexfactory.com/attachm...1&d=1576450077