I take it that we are all happy to accept price makes these adjustments and then goes for the newly adjusted targets.
It just goes to show that there is always something new to discover and we should never quit learning and recording our findings.
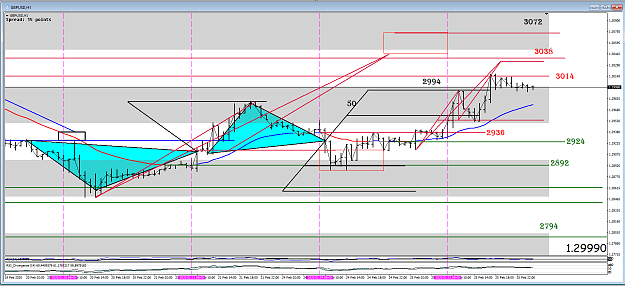
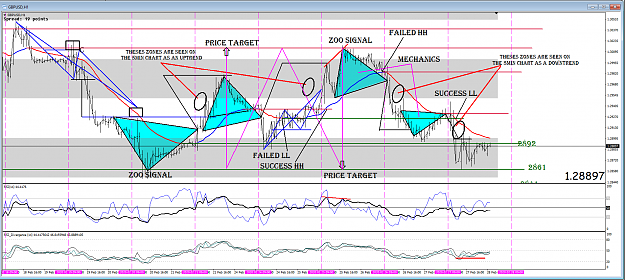
For our diary of events we see on the 1 hour chart below the average was attempting the 2936 and made it. In doing so price should reach the next level 3014 and it did that also.
Putting things together we have the swing averages as targets and the mechanics of getting there via our A---D setups and this comes together with a great deal of accuracy because it is based upon the equal swings of sentiment. That is to say a buyer sells and a seller buys as money passes from one hand to another. The beauty is that we can convert the math to a graphical chart we can all follow.
I take it that we are all happy to accept price makes these adjustments and then goes for the newly adjusted targets. It just goes to show that there is always something new to discover and we should never quit learning and recording our findings. For our diary of events we see on the 1 hour chart below the average was attempting the 2936 and made it. In doing so price should reach the next level 3014 and it did that also. Putting things together we have the swing averages as targets and the mechanics of getting there via our A---D setups and this...
That was it again.
The Sell target H1 EMA = M15 EMA = M5 EMA swing lows.
And now if I am not mistaken, the Hook. That could be easily the case with the H1 M15 M5 Bull div's and enough H1 room to the upside.
My risk is tight, entry 1.2925. Hope it makes it and hope bears are not too strong on M5.
I take it that we are all happy to accept price makes these adjustments and then goes for the newly adjusted targets. It just goes to show that there is always something new to discover and we should never quit learning and recording our findings. For our diary of events we see on the 1 hour chart below the average was attempting the 2936 and made it. In doing so price should reach the next level 3014 and it did that also. Putting things together we have the swing averages as targets and the mechanics of getting there via our A---D setups and this...
Ignored
Hi Alan,
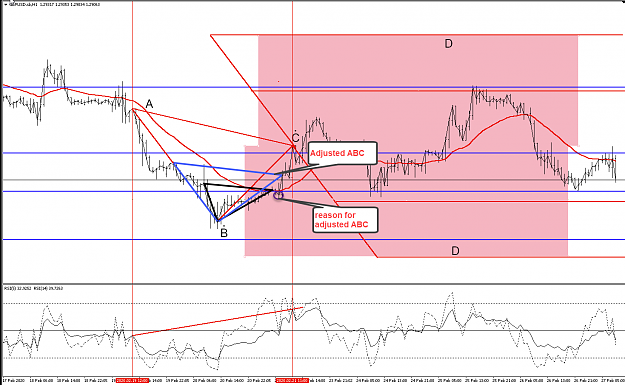
Thinking about your comments above, Not sure if this is any help, I have added a parameter to allow for multiple targets to be identified from the same (B) (High/Low) it might help identify any value in the "C" adjustments and if so would be great to hear you and the other contributors view on the "C" adjustment. Warning though as it draws several triangles it can get a bit messy. If it doesn't add any value please feel free to just ignore it
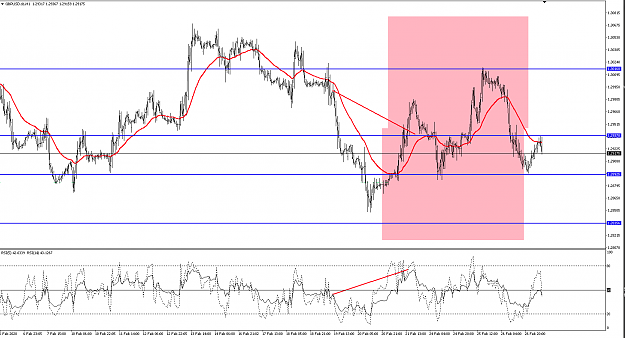
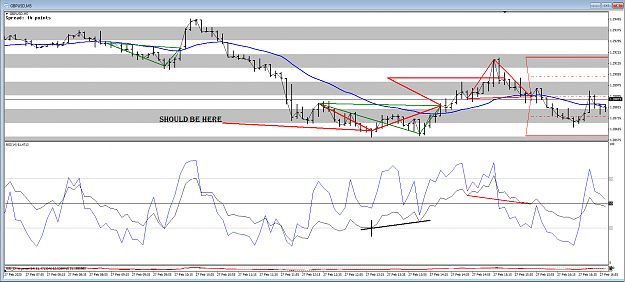
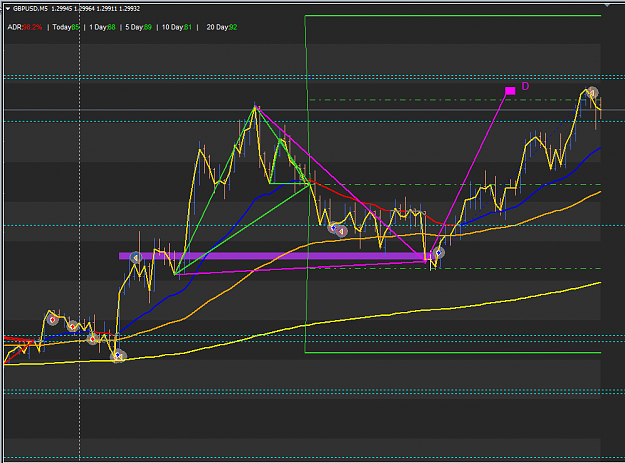
I've been watching this set up over the past few days. It's an ABCD on the 60m. Price rose then dipped to the first EMA low then went up to about 50% of the top red rectangle touching the blue line which is also the next EMA high. Yesterday price dropped all the way to test the EMA low again. Interesting to see if price continues to push towards the target being the bottom of the lower red box. Thoughts please.
I've been watching this set up over the past few days. It's an ABCD on the 60m. Price rose then dipped to the first EMA low then went up to about 50% of the top red rectangle touching the blue line which is also the next EMA high. Yesterday price dropped all the way to test the EMA low again. Interesting to see if price continues to push towards the target being the bottom of the lower red box. Thoughts please. {image}
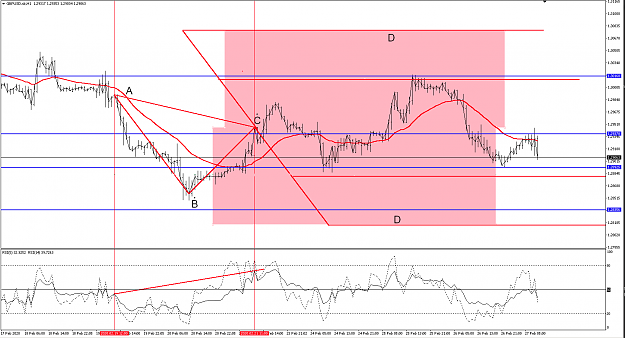
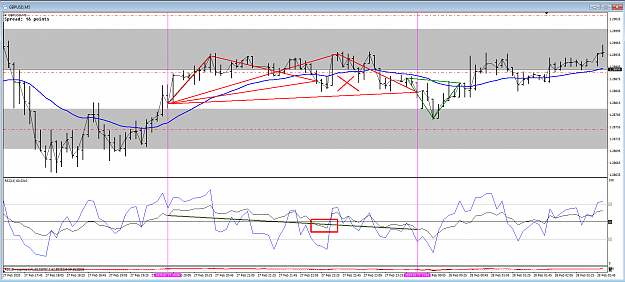
Sorry about the slow response Jazz, I am a bit slow drawing these. I hope this helps. {image}
Ignored
I can draw 2 valid ABCD's there, the first one at the first cross of the EMA, the second one after the cross and recross of the EMA. Maybe this is a new variation but i guess then you can draw an ABCD after every price high. Don't know, this is for the profs.
There has been a lot going on this week and it is still only Friday but this is what the 1 hour chart looks like for the diary of events. {image} Interesting to note that from Thursday to Thursday Price did not move at all despite many fortunes won and lost over the period. Note how there is always a mechanical method of taking price to the average swings and these are seen as good trends on the 5min chart. Now are the bears going to make the LL average or are the bulls going to stop them? I am looking at this blue AB =CD on the hour chart... {image}...
Ignored
Hi Alan,
Hoping you could clarify a couple of things for me if you dont mind.
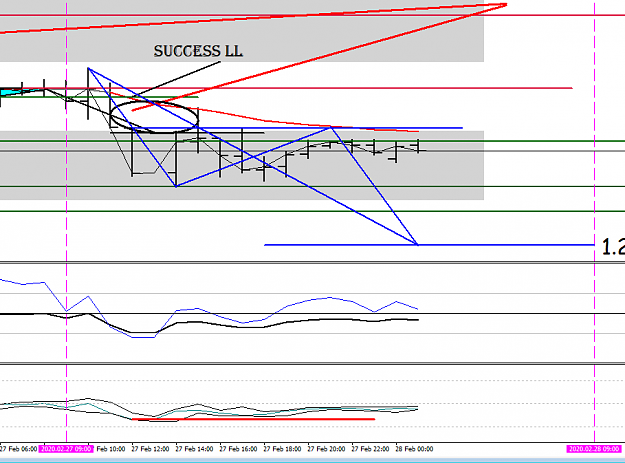
The H1 chart above are you drawing your average swing levels manually or using the indicator. Im using the indicator and the level you have at 2861 it plotted mine at 28581, thus price has not touched the level. I know its not a lot but with the precision of the system this tends to throw me out of whack with what I look at doing next. I have checked the swing level price on 2 different Brokers one of which you mentioned you use and I get the 2858 level. It is a regular thing for me to see you post that price touched to the pip and mine is a few pips out and not touched the level. So if you are able to shed any light as to why it would be greatly appreciated.
The other thing is if you are able to confirm if with the indi that Des was kind enough to code, are you getting the ABCD triangle High/Low being plotted on the High/Low of price and not on the High/Low of the 14 RSI.
Hope this makes sense and Thanks for your time and hope Im not wasting it.
{quote} Hi Alan, Hoping you could clarify a couple of things for me if you dont mind. The H1 chart above are you drawing your average swing levels manually or using the indicator. Im using the indicator and the level you have at 2861 it plotted mine at 28581, thus price has not touched the level. I know its not a lot but with the precision of the system this tends to throw me out of whack with what I look at doing next. I have checked the swing level price on 2 different Brokers one of which you mentioned you use and I get the 2858 level. It is...
Ignored
Yes I plot everything by hand. I rarely close on the exact location this just serves to give me an idea of the size of the trade. Once I get my pips then that is enough for me.
That line 2861 goes back a long way so much so the thickness of the line makes a difference.
I just checked on the 5 min chart and Des's plot does not allow for the divergence on the RSI however we could say the difference is a possible range to be hit and if we opt for the least then we won't be disappointed if it doesn't make the max.
 Trading the Cable swings via averages