Translation of the Chart for the Dummies and the Newbies :
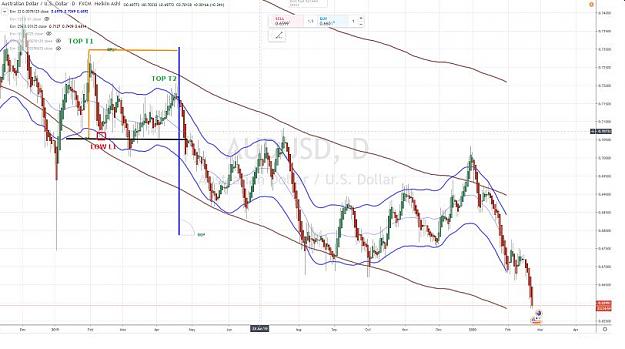
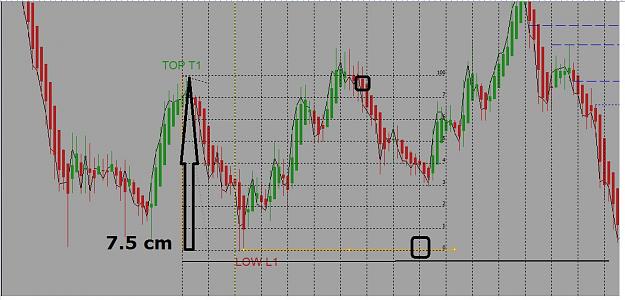
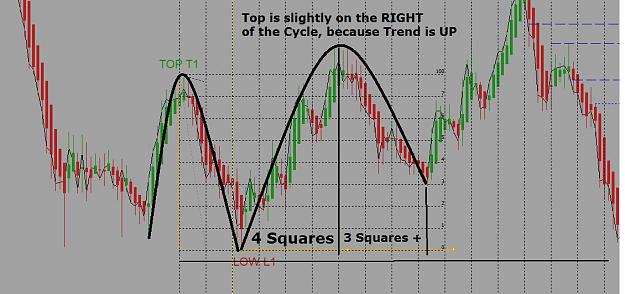
a) notice the Low L1 in red
b) notice the Top T1 in Green
c) Draw an Horizontal Line (angle 0°) in black from the Low L1
d) Draw a vertical line from the Top T1 up to this horizontal line in black
e) measure the distance between the Top T1 and the black Line : this is represented by the orange vertical line = your Measured Move in Price
f) return to the Low L1 , starting from this Low draw an Horizontal Line of the same length that the length of your Measured Move in Price
g)now, from the last point of this horizontal line , draw a vertical line - here the vertical Line in blue
what do you catch : a Top labeled T2 !
Notice the following points :
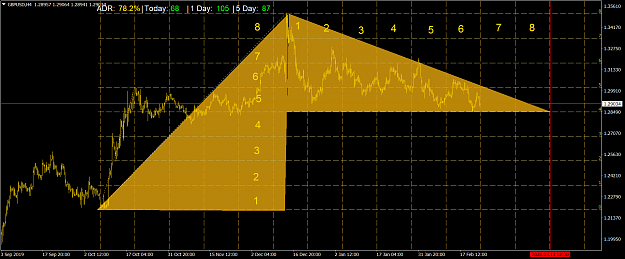
Jenkins shows you with the TCB method after having converted in Time Units your Measured Move in Price , you should reach a Pivot Point on the Time Axis - a Low or a Top
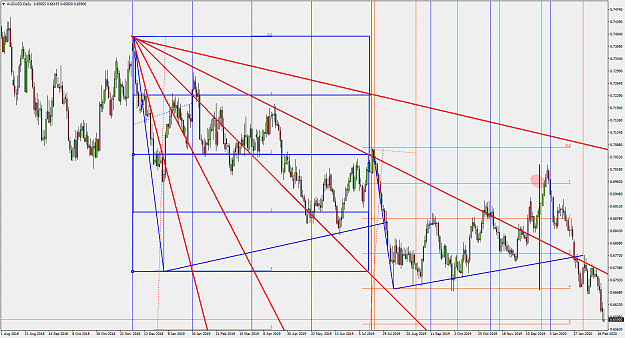
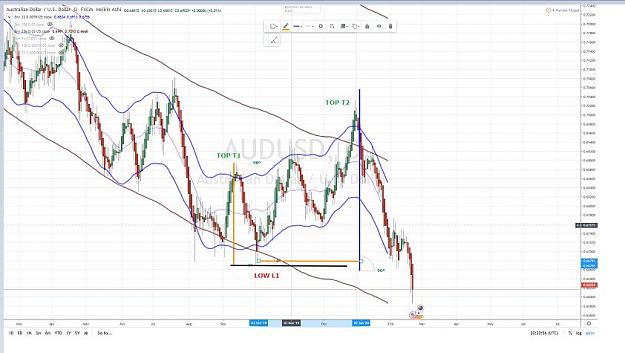
Parisboy which is totally stubborn regarding Envelopes observes that at this exact same moment Price Action has reached and crossed the Centered Moving Average 256 (in brown) and the Upper Limit of the Envelope 32 (in blue) and that Heikin Ashi Candles turn from bearish red to.bullish green.
Hence Parisboy considers a Short with a Stop Loss located slightly above the Last Top labeled T2
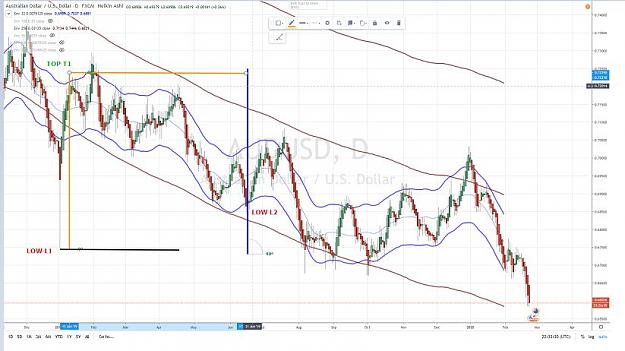
a) notice the Low L1 in red
b) notice the Top T1 in Green
c) Draw an Horizontal Line (angle 0°) in black from the Low L1
d) Draw a vertical line from the Top T1 up to this horizontal line in black
e) measure the distance between the Top T1 and the black Line : this is represented by the orange vertical line = your Measured Move in Price
f) return to the Low L1 , starting from this Low draw an Horizontal Line of the same length that the length of your Measured Move in Price
g)now, from the last point of this horizontal line , draw a vertical line - here the vertical Line in blue
what do you catch : a Top labeled T2 !
Notice the following points :
Jenkins shows you with the TCB method after having converted in Time Units your Measured Move in Price , you should reach a Pivot Point on the Time Axis - a Low or a Top
Parisboy which is totally stubborn regarding Envelopes observes that at this exact same moment Price Action has reached and crossed the Centered Moving Average 256 (in brown) and the Upper Limit of the Envelope 32 (in blue) and that Heikin Ashi Candles turn from bearish red to.bullish green.
Hence Parisboy considers a Short with a Stop Loss located slightly above the Last Top labeled T2
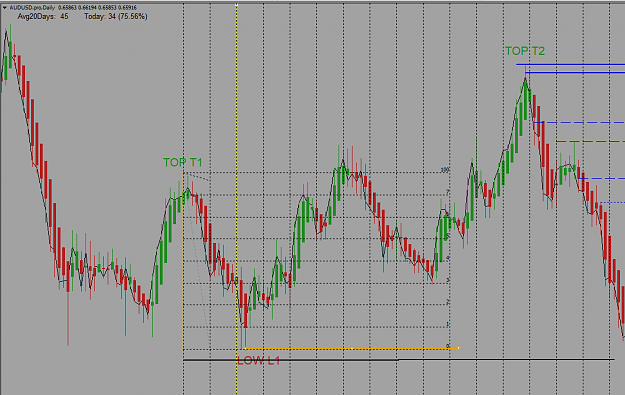
Attached Image (click to enlarge)
2