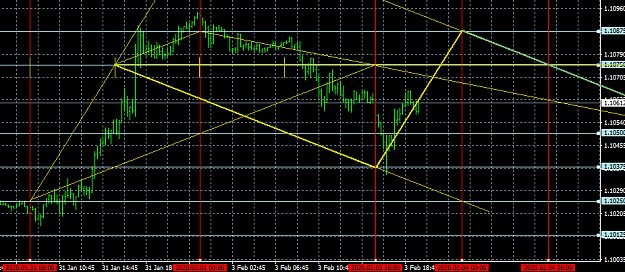
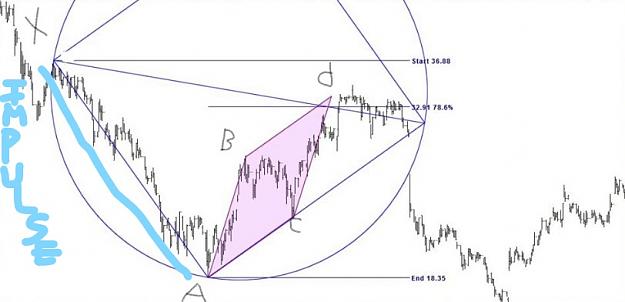
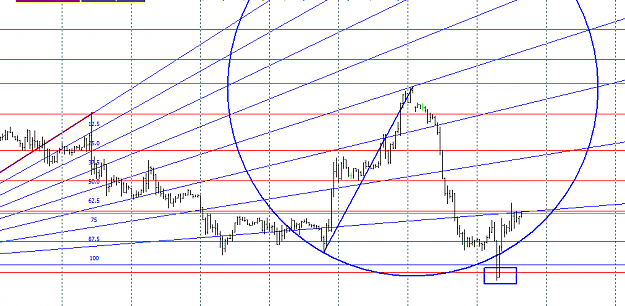
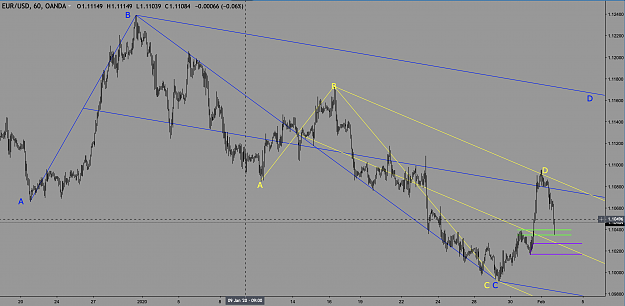
• Home
  • Forums
  • Trades
  • News
  • Calendar
  • Market
  • Brokers
  • Login
  • Join
  • User/Email: Password:
  • 1:43pm
Menu
  • Forums
  • Trades
  • News
  • Calendar
  • Market
  • Brokers
  • Login
  • Join
  • 1:43pm
Sister Sites
  • Metals Mine
  • Energy EXCH
  • Crypto Craft

Options

Bookmark Thread

First Page First Unread Last Page Last Post

Print Thread

Similar Threads

All the Forecasting and Prediction indicators on the market? 18 replies

Economic Indicator Forecasting by Banks: Why and how 4 replies

Forecasting about currencies 9 replies

Anticipation vs. Forecasting 0 replies

Neral Networks to perform technical forecasting 0 replies

  • Trading Journals
  • /
  • Reply to Thread
  • Subscribe
  • 3,670
Attachments: Time and Price Forecasting
Exit Attachments

Time and Price Forecasting

  • Last Post
  •  
  • 1 8283Page 848586 240
  • 1 Page 84 240
  •  
  • Post #1,661
  • Quote
  • Feb 3, 2020 10:15am Feb 3, 2020 10:15am
  •  Winston Reed
  • Joined Mar 2009 | Status: Hobby Trader | 4,475 Posts
Quoting Winston Reed
Disliked
Looking forward to the big game today! EURUSD60min pre-open analysis and a little about median lines(forks): The chart shows 2 forks. The blue modified schiff fork is the major fork (based on the large swing A to B). This fork is still in process. If price makes it to the upper median line of the blue fork, C to D the fork will be complete. The yellow modified schiff fork is drawn off smaller swings and it is actually a completed fork. It is important to understand that the "lines" are not magical when using forks. They merely attempt to project...
Ignored
EURUSD60min. For overall context.
Attached Image (click to enlarge)
Click to Enlarge

Name: Screen Shot 2020-02-03 at 8.12.05 AM.png
Size: 433 KB


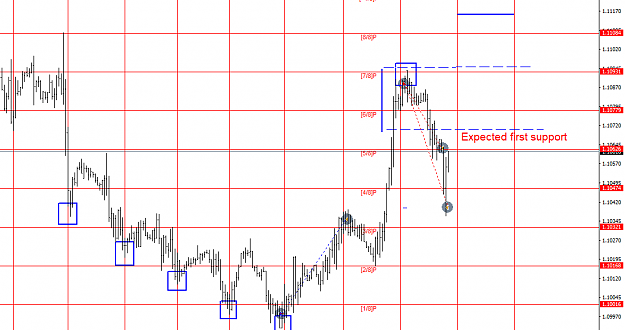
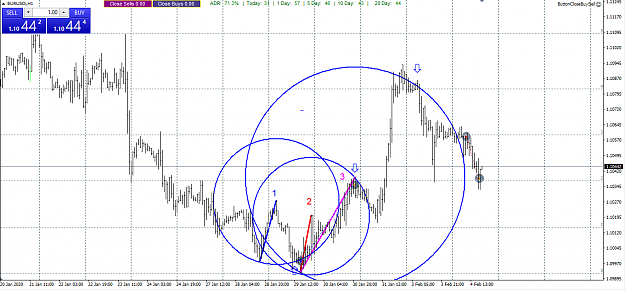
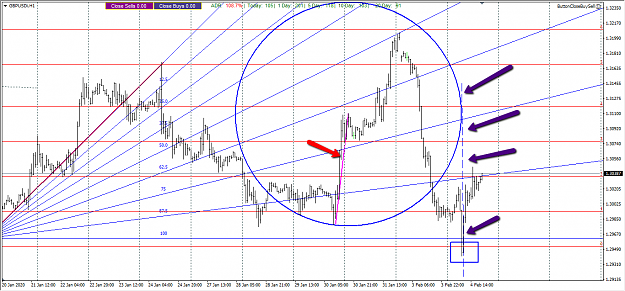
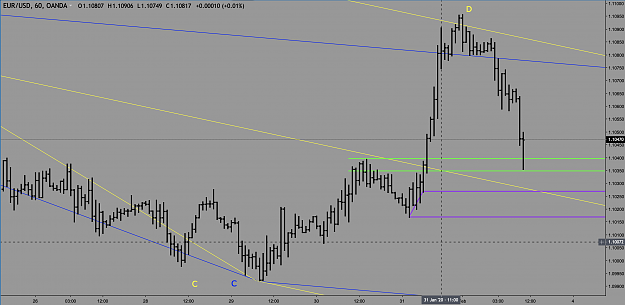
Testing the are where price zoomed the median line. Buyers here.
Attached Image (click to enlarge)
Click to Enlarge

Name: Screen Shot 2020-02-03 at 8.12.35 AM.png
Size: 363 KB
Hobby Trader
 
1
  • Post #1,662
  • Quote
  • Feb 3, 2020 11:48am Feb 3, 2020 11:48am
  •  Swede
  • Joined Mar 2009 | Status: Member | 2,302 Posts
[quote=makenas;12734518]{quote} Hello, forgive me but this time i do not understand how you do this,do you just use vertical lines for highs and lows swings for the cycle and to find the s/r, am really lost[/quote

I didn't explain that very well....what I was trying to say is we do not have to have the best technology or the best charts to determine where price has a high probability to reverse direction. That is the point of Time and Price Forecasting. We can find these areas manually by simply finding a predominant swing high to low, measure that distance(in this case 24 candles) and use that distance to measure out the cycles going forward...(red vertical lines). Then we can use that same distance to measure expected distance price may reverse as a First Support (in this case) It is a method Jenkins uses.

Here is the result of that trade last night. I took partial profit just under the first move down to support....took the rest off the table as it spiked down to what I determined was a strong area of support.

Notice Winstons chart above...same area he determined, LVCa...same determination....so many ways to skin this cat...I was just illustrating one from Jenkins..
Attached Image (click to enlarge)
Click to Enlarge

Name: 2020-02-03_0947.png
Size: 25 KB
 
4
  • Post #1,663
  • Quote
  • Feb 3, 2020 12:38pm Feb 3, 2020 12:38pm
  •  Swede
  • Joined Mar 2009 | Status: Member | 2,302 Posts
Attached Image (click to enlarge)
Click to Enlarge

Name: 9D8F3AA9-1420-40F8-B84E-85F1B7435B38.jpeg
Size: 293 KB
Attached Image (click to enlarge)
Click to Enlarge

Name: DA105A56-A6E2-4C1C-8AC6-54C852BD01FF.png
Size: 379 KB
 
4
  • Post #1,664
  • Quote
  • Feb 3, 2020 1:28pm Feb 3, 2020 1:28pm
  •  gettoefl
  • Joined Mar 2013 | Status: Member | 880 Posts
if gets to 110875 by ny close will sell with 5 pip stop currently 11061
Attached Image (click to enlarge)
Click to Enlarge

Name: Screenshot1.png
Size: 45 KB
twitter: @gettoefl
 
 
  • Post #1,665
  • Quote
  • Edited at 3:15pm Feb 3, 2020 2:22pm | Edited at 3:15pm
  •  vik11
  • | Joined Jan 2020 | Status: Member | 54 Posts
I'm having an interesting time practicing the Jenkins way of putting angles on a chart. On MT5 that is. I don't know whether what I've drawn is valid or not. So would appreciate any feedback. Thanks.
Attached Image (click to enlarge)
Click to Enlarge

Name: USDJPYDaily circle square angles.png
Size: 76 KB


I had an epithany just now, looking at that chart. Obvious to many, I know, but I was thinking Jenkins said that if price breaks an angle line it has to keep going to the next one. But on that chart price breaks lines above it but does not keep going up to the next one. It does when it crosses below an angle line though - of course, on the bigger time frame it's a downtrend - has been since 2016!

I'm probably getting carried away now, but wouldn't it be worth selling USDJPY down to that next angle line? 80+ pips there. The high of the current daily candle is an exact 61.8 retracement of the previous candle. Maybe should wait for it to close. Just throwing it out there.

Attached Image (click to enlarge)
Click to Enlarge

Name: USDJPYDaily circle square angles 2.png
Size: 71 KB
 
1
  • Post #1,666
  • Quote
  • Feb 3, 2020 2:48pm Feb 3, 2020 2:48pm
  •  makenas
  • Joined Jun 2016 | Status: Member | 122 Posts
Quoting Swede
Disliked
{image}{image}
Ignored
Thank you, now its clear and yes i have tried that also but was lost,now i can get it
 
 
  • Post #1,667
  • Quote
  • Edited at 5:03pm Feb 3, 2020 4:09pm | Edited at 5:03pm
  •  DiamondMiner
  • Joined Jun 2018 | Status: Member | 858 Posts
Quoting vik11
Disliked
I'm having an interesting time practicing the Jenkins way of putting angles on a chart. On MT5 that is. I don't know whether what I've drawn is valid or not. So would appreciate any feedback. Thanks.{image} I had an epithany just now, looking at that chart. Obvious to many, I know, but I was thinking Jenkins said that if price breaks an angle line it has to keep going to the next one. But on that chart price breaks lines above it but does not keep going up to the next one. It does when it crosses below an angle line though - of course, on the bigger...
Ignored
Vik11, there are some corrections, but your getting the idea...remember it begins with the impulse wave.
Attached Image (click to enlarge)
Click to Enlarge

Name: Circumcircle.jpg
Size: 84 KB
Attached Image (click to enlarge)
Click to Enlarge

Name: Circumcircle_.jpg
Size: 44 KB
Attached Image (click to enlarge)
Click to Enlarge

Name: InkedCircle Square Quad_LI-edit.jpg
Size: 192 KB
Dyad showing Time and Price Reversals
Attached Image (click to enlarge)
Click to Enlarge

Name: Dyad showing time and price reversal.jpg
Size: 43 KB
You NEVER will be the person you could be, without pressure & discipline
 
3
  • Post #1,668
  • Quote
  • Feb 3, 2020 4:28pm Feb 3, 2020 4:28pm
  •  LvCa
  • | Joined Oct 2014 | Status: Member | 174 Posts
Quoting Swede
Disliked
Quoting makenas
Disliked
{quote} Hello, forgive me but this time i do not understand how you do this,do you just use vertical lines for highs and lows swings for the cycle and to find the s/r, am really lost[/quote I didn't explain that very well....what I was trying to say is we do not have to have the best technology or the best charts to determine where price has a high probability to reverse direction. That is the point of Time and Price Forecasting. We can find these areas manually by simply finding a predominant swing high to low, measure that
Ignored
...
Ignored

I really appreciate the simplicity, my two cents: whatever the way, the important thing is to understand where you are (in the market and beyond) ... It is not easy but we try.
Ps : i like so mutch your post
 
1
  • Post #1,669
  • Quote
  • Feb 4, 2020 12:02pm Feb 4, 2020 12:02pm
  •  Swede
  • Joined Mar 2009 | Status: Member | 2,302 Posts
@ LVCa....Using circle scripts can really pinpoint POTENTIAL turning points...if all other factors are in place it alerts the trader to some very nice trade opportunities.

Below....trade number one LONG was taken off the first circle....blue impulse....

Below...trade number one profit was taken at top of second circle...red impulse (should have stayed long but at that point it did pull back 25 pips)

Below...look at the third impulse ...majenta...did it not alert the trader where he might place short trades again as price reverted back to the overall trend
Attached Image (click to enlarge)
Click to Enlarge

Name: 2020-02-04_1001.png
Size: 45 KB
 
3
  • Post #1,670
  • Quote
  • Feb 4, 2020 12:25pm Feb 4, 2020 12:25pm
  •  DiamondMiner
  • Joined Jun 2018 | Status: Member | 858 Posts
Quoting Swede
Disliked
@ LVCa....Using circle scripts can really pinpoint POTENTIAL turning points...if all other factors are in place it alerts the trader to some very nice trade opportunities. Below....trade number one LONG was taken off the first circle....blue impulse.... Below...trade number one profit was taken at top of second circle...red impulse (should have stayed long but at that point it did pull back 25 pips) Below...look at the third impulse ...majenta...did it not alert the trader where he might place short trades again as price reverted back to the overall...
Ignored
What I am beginning to notice: There are some of you guys that are afraid to try or afraid to fail. That's OK, failure is how we learn, it's alright to make a mistake or not understand. I ask you to engage(jump in). That is how we learn. I taught my son the hardest part about doing anything is: STARTING. Today he has a Masters degree in Cybersecurity, Bachelors degree in Computer Science, and 6 cybersecurity certifications. So, getting back on topic, It all starts with the IMPULSE WAVE. From there you try adding your tetrad, triad, dyad, circle, Then diagonal lines... Experiment... this is how it's done.
You NEVER will be the person you could be, without pressure & discipline
 
4
  • Post #1,671
  • Quote
  • Feb 4, 2020 12:37pm Feb 4, 2020 12:37pm
  •  Swede
  • Joined Mar 2009 | Status: Member | 2,302 Posts
Impulse
Attached Image (click to enlarge)
Click to Enlarge

Name: FFF23844-2D8D-465D-9D34-E716F4937BB3.png
Size: 290 KB
 
4
  • Post #1,672
  • Quote
  • Feb 4, 2020 12:51pm Feb 4, 2020 12:51pm
  •  Swede
  • Joined Mar 2009 | Status: Member | 2,302 Posts
Even If one uses circles on large swings and a reversal occures...where might the dumping abate.....gbp is not that hard to trade using the method of dividing the last major swing by 8 to determine support or resistance, then add a circle to the last major impulse move...now you have a roadmap.
Attached Image (click to enlarge)
Click to Enlarge

Name: 2020-02-04_1046.png
Size: 26 KB
 
3
  • Post #1,673
  • Quote
  • Feb 4, 2020 1:42pm Feb 4, 2020 1:42pm
  •  Swede
  • Joined Mar 2009 | Status: Member | 2,302 Posts
And had you drawn the circle from the first impulse wave from last Thurday and left it on your chart....drawing a vertical line from the right side of the circle gave you a pin point reversal area....
Attached Image (click to enlarge)
Click to Enlarge

Name: 2020-02-04_1137.png
Size: 76 KB
 
3
  • Post #1,674
  • Quote
  • Edited at 3:35pm Feb 4, 2020 2:02pm | Edited at 3:35pm
  •  vik11
  • | Joined Jan 2020 | Status: Member | 54 Posts
Quoting vik11
Disliked
... on that chart price breaks lines above it but does not keep going up to the next one ...I'm probably getting carried away now, but wouldn't it be worth selling USDJPY down to that next angle line? 80+ pips there. The high of the current daily candle is an exact 61.8 retracement of the previous candle. Maybe should wait for it to close. Just throwing it out there. {image}
Ignored
Not sure what I was looking at last night. There are a whole lot of higher highs and higher lows there, and price crossing above angle lines and on to the next angle line above. Even if that's only a correction of the monthly and weekly downtrend, if you're trading the daily it's an uptrend.

Yup, lots to learn!


Attached Image (click to enlarge)
Click to Enlarge

Name: Screenshot_1.png
Size: 77 KB
 
1
  • Post #1,675
  • Quote
  • Feb 4, 2020 3:26pm Feb 4, 2020 3:26pm
  •  DiamondMiner
  • Joined Jun 2018 | Status: Member | 858 Posts
Guys, please do not post any charts with Ichimoku Cloud indicators on my Thread. It was nothing to do with this threads agenda.
Thanks Guys...
P
You NEVER will be the person you could be, without pressure & discipline
 
4
  • Post #1,676
  • Quote
  • Feb 4, 2020 8:14pm Feb 4, 2020 8:14pm
  •  Swede
  • Joined Mar 2009 | Status: Member | 2,302 Posts
A live Jenkins Secret Angle trade...as you can see stops used...not sure if Jpy ready to retest but we will see....target is the 50% arrow..
Attached Image (click to enlarge)
Click to Enlarge

Name: 2020-02-04_1809.png
Size: 62 KB
 
2
  • Post #1,677
  • Quote
  • Feb 5, 2020 1:03am Feb 5, 2020 1:03am
  •  makenas
  • Joined Jun 2016 | Status: Member | 122 Posts
Quoting Swede
Disliked
A live Jenkins Secret Angle trade...as you can see stops used...not sure if Jpy ready to retest but we will see....target is the 50% arrow.. {image}
Ignored
Thanks for your help,how do you have both script on the charts? i tried that but it seems i need to get one off the charts
 
 
  • Post #1,678
  • Quote
  • Feb 5, 2020 1:51am Feb 5, 2020 1:51am
  •  Aworex
  • | Joined Jul 2013 | Status: Member | 82 Posts
Nice illustration Swede hover looking at the larger picture the price is just past the 50% level, that retracement might be minimal
Attached Image (click to enlarge)
Click to Enlarge

Name: USDJPY-1Hr.png
Size: 86 KB
 
 
  • Post #1,679
  • Quote
  • Feb 5, 2020 2:13am Feb 5, 2020 2:13am
  •  makenas
  • Joined Jun 2016 | Status: Member | 122 Posts
Quoting makenas
Disliked
{quote} Thanks for your help,how do you have both script on the charts? i tried that but it seems i need to get one off the charts
Ignored
sorry i did not look at it closely, now i see its not the circle script,my bad
 
 
  • Post #1,680
  • Quote
  • Feb 5, 2020 7:31am Feb 5, 2020 7:31am
  •  DiamondMiner
  • Joined Jun 2018 | Status: Member | 858 Posts
Quoting Swede
Disliked
A live Jenkins Secret Angle trade...as you can see stops used...not sure if Jpy ready to retest but we will see....target is the 50% arrow.. {image}
Ignored
Nice call Swede on the Impulse wave thus forming a Dyad now showing where the correction show be and actually was. Then, applying the S.A., Great Job !!! It's called Thinking Outside the Box.
You NEVER will be the person you could be, without pressure & discipline
 
 
  • Trading Journals
  • /
  • Time and Price Forecasting
  • Reply to Thread
    • 1 8283Page 848586 240
    • 1 Page 84 240
3 traders viewing now
  • More
Top of Page
  • Facebook
  • Twitter
About FF
  • Mission
  • Products
  • User Guide
  • Media Kit
  • Blog
  • Contact
FF Products
  • Forums
  • Trades
  • Calendar
  • News
  • Market
  • Brokers
  • Trade Explorer
FF Website
  • Homepage
  • Search
  • Members
  • Report a Bug
Follow FF
  • Facebook
  • Twitter

FF Sister Sites:

  • Metals Mine
  • Energy EXCH
  • Crypto Craft

Forex Factory® is a brand of Fair Economy, Inc.

Terms of Service / ©2022