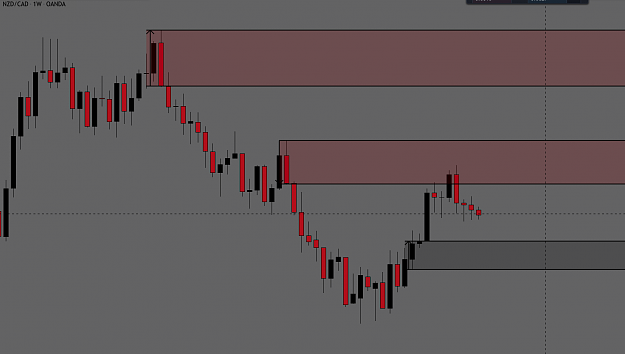
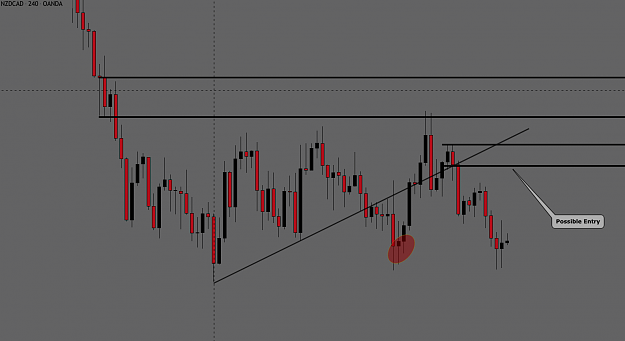
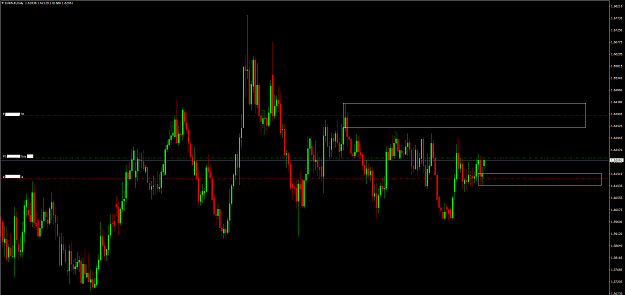
Disliked{quote} I determine trend by just following which way price is taking out supply or demand zones and creating fresh zones in that direction. On the pull back to the fresh zone you should be trading with the recent trend on a whole. The time frames are completely down to you. Are you a scalper / intraday type trader / swing trader? If you are a scalper you should be focusing on smaller time frames, perhaps the 5M / 15M / 1H for example. If you are a swing trader you should be focusing on the higher time frames such as the 1D / 1W / 1M. It's all down...Ignored
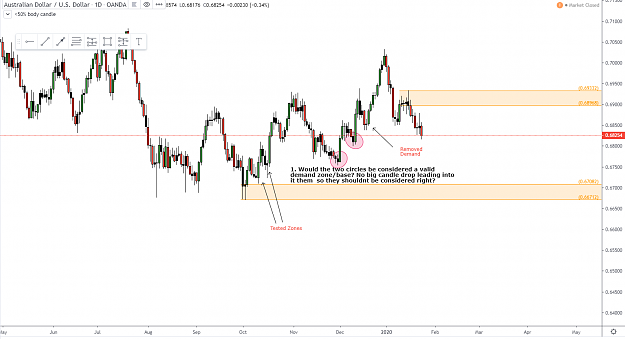
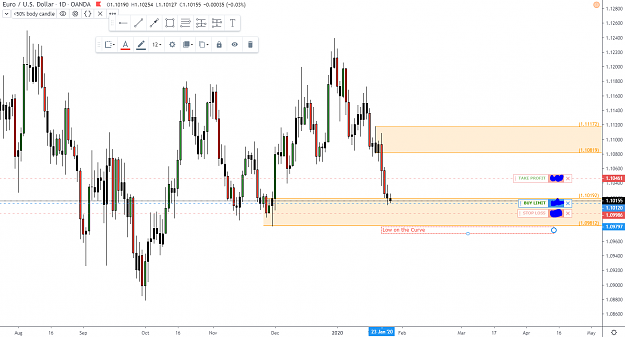
But how many opposing zones has to be created or removed before one can validate a change of trend and trade according to the trend if I may ask