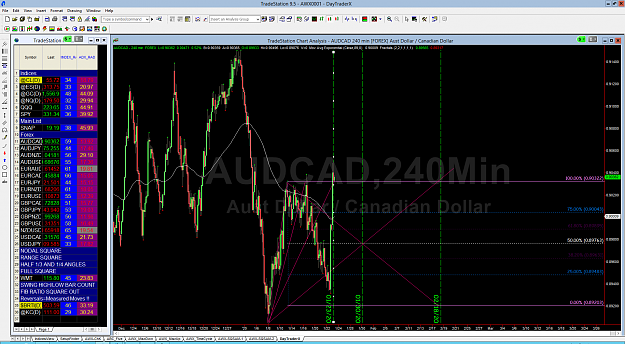
so this is the b in progress for eurusd a good time to initiate sell limits, based on gann we already know when the big ABC is finished recall the quarter of quarter post
Ignored
got in the top of b with the c now underway and we all know when c will finish and the bull commence thank goodness just make sure you add six hours to each quarter for the leap year, trades as always posted on twitter for anyone who trades, price target is twice as far as we attained in the first half of the quarter namely seventy five pips but there will be a ton of vol at that bottom just like there was on day one of the decade so plus or minus fifty is wise
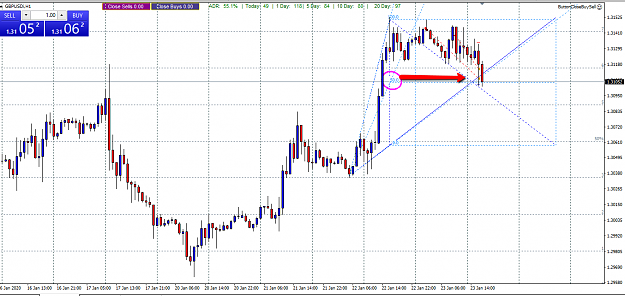
Hello My Friends! I was away for a longer timeframe, but Today I wanted to try those two scripts (1 - Jenkins angle and 2 - Circle script). Found something nice. Thanks DiamondMiner for main idea. But the idea is simple. Just put angle script on chart, and go from HI to LOW or vice versa, and simply put trendline on the right side of the chart. Then You will be able to know, what candle will be the reversal candle. Worked everytime I tried it. (Maybe luck?)
Not sure what timeframe use and so on, but well.. Why not. Maybe something good will come from it.
Hello My Friends! I was away for a longer timeframe, but Today I wanted to try those two scripts (1 - Jenkins angle and 2 - Circle script). Found something nice. Thanks DiamondMiner for main idea. But the idea is simple. Just put angle script on chart, and go from HI to LOW or vice versa, and simply put trendline on the right side of the chart. Then You will be able to know, what candle will be the reversal candle. Worked everytime I tried it. (Maybe luck?) Not sure what timeframe use and so on, but well.. Why not. Maybe something good will come...
{quote} got in the top of b with the c now underway and we all know when c will finish and the bull commence thank goodness just make sure you add six hours to each quarter for the leap year, trades as always posted on twitter for anyone who trades, price target is twice as far as we attained in the first half of the quarter namely seventy five pips but there will be a ton of vol at that bottom just like there was on day one of the decade so plus or minus fifty is wise
Ignored
stop break even 1.11 ... nearing target but time is on our side so do no hurry
looks like second eight days is an exact replica of the first eight, we saw the paths of the first eight just do exact same reverse order so we will end up twice as far down to end the first quarter of the first quarter, it really is that easy
Ignored
11050
on the money as explained ... 1.12->1.1125 first 8 days, 1.1125->11050 for second 8 ... seems bill gann knew what he was talking about
{quote} 11050 on the money as explained ... 1.12->1.1125 first 8 days, 1.1125->11050 for second 8 ... seems bill gann knew what he was talking about in the plus or minus 50 pips zone presently
Ignored
Please post a chart when you can. I want to understand your points better. Thanks
One thing I have found very useful for the Jenkins Secret Angle (and I use it on pretty much every chart now)...not necessarily for entries, but often for exits...
Yesterday clearly showed where resistance north was located on the 4 hour Cable chart...but then when tooling down to the hour chart the entries on test of the high were entered...and reversion to the mean...the 50% level established is often the perfect spot to take profit....
Now that's for my style of trading...short term, square at the end of the day etc. for what that is worth...
{quote} I've preached patterns as fractals for many years now Bones... some people get it, most don't. It has a lot to do with mapping price, but like I said, I rarely map it, I just trade. Some people actually pay attention closely to what I say, and when I say the tick pattern is the DNA of lager patterns they will understand that it's the smallest fractal of the pattern. The fractals mature across each and every time period... from the smallest to the largest, at varying times, based on the time period. Been preaching it for years now.... -CJ-...
Ignored
https://www.stevehopwoodforex.com/ph...129034#p129034
When I say "patterns repeat across all time frames", MOST people look for a small section or pattern and then try to "force" it into another time frame. Some start low and work up, some start high and work back. However....
THE ENTIRE PATTERN THAT RUNS ON THE LOWER TIME FRAME WILL BE REPEATED IN IT'S ENTIRETY ON THE HIGHER TIME FRAMES....
This is how I map price such as the EURUSD chart. Understand that price patterns are fractals. As with all fractals, the closer you look (lower time frames), the less smooth (dirtier), they become. As the time frame becomes larger, the fractals edges become smoother, presenting a less jagged or dirty image. This is why I don't advocate looking below the 15m time frame. As stated before, the patterns are "born" on the tick chart and the mature across ALL time frames... with the pattern "smoothing' as it matures. This process takes years as demonstrated with the EURUSD chart. The patterns are continuous.
Now consider this.... if this is true, and I believe I have shown it to be true, the forex market is in no way a random market based on supply and demand. Think about this...how can a tick chart pattern that takes 10-15 seconds to print become the exact same pattern on a D1 chart that takes months and years to print? Not to mention the fact that the same tick pattern has completed many times over on each of the lower time frames before the D1 pattern completes. It is how the candle patterns on the charts are created.
The closest I could come as to the source of the monthly map is on D1, starting from about 2011.05 to 2012.01
[ compare EURUSD MN chart to EURUSD D1 chart from 2011.05 ]
{quote} The EURUSD map in question: https://www.forexfactory.com/showthr...5#post11632795 First time I saw it was in 2012 :O The closest I could come as to the source of the monthly map is on D1, starting from about 2011.05 to 2012.01 [ compare EURUSD MN chart to EURUSD D1 chart from 2011.05 ]
so 11035 was 15 pips below target not +-50 which was the max ... time is nearly done so long limits are set now ... as i wrote last weekend when talking about Elliott wave, right here should be the bottom for long time to come