NZD/USD seems to be failing. Wasn't there a valid buy entry?
Ignored
D1 OS cycle. W1 OB cycle with elasticity. MN LH sequence with elasticity. I expect the W1 elasticity resume when D1 bull cycle Will end. Before that you can net 100 pips Up. When D1 and W1 meet Up then start chasing the MN bear LH sequence movement. Hope you will get it
{quote} D1 OS cycle. W1 OB cycle with elasticity. MN LH sequence with elasticity. I expect the W1 elasticity resume when D1 bull cycle Will end. Before that you can net 100 pips Up. When D1 and W1 meet Up then start chasing the MN bear LH sequence movement. Hope you will get it
Ignored
This is weekend and no live trading. So, illustrate the above using image, please
NZD/USD seems to be failing. Wasn't there a valid buy entry?
Ignored
Now its making a retrace but please go to H4 and check the elasticity, Then go to D1 stoch and compare with W1 and MN, Prcie will go up but on D1 trading things go slow and big drawdowns are common till trade goes green. Thats D1 nature. If you trade for big and slow profit be prepared for big and slow drawdown first
{quote} Your entry is one candle late. Entry 10 pips under the close of the bear hammer as per HH failure rule
Ignored
Do you take Elasticity between Stochs rule into account for entry with HH / LL Failure rule or just the failure and candle pattern is enough for entry? On your definition (Post #28), you state "When a new high or low is made during the elasticity development within the pullback". So according to your definition, the pullback must meet Elasticity Rule, but I saw some chart examples with HH / LL Failure trades which do not meet this rule. Therefore I just asked to make sure if there must be elasticity between stochs for this type of trades. Thanks in advance.
On post #25, you wrote "I measure divergence according to the slower stoch 14 3 3 (red one) not the fast 5 3 3".
On post #33, you wrote "You can spot the hidden divergence in any of the stochs but I prefer to see the divergence on the 5 3 3 the fastest one".
You measure hidden divergence, without Elastic Divergence, on slower stoch 14 3 3, but when there is an Elastic Divergence, you prefer faster stoch 5 3 3 to spot hidden divergence. Would you please confirm if my understanding is correct? Thanks.
{quote} Do you take Elasticity between Stochs rule into account for entry with HH / LL Failure rule or just the failure and candle pattern is enough for entry? On your definition (Post #28), you state "When a new high or low is made during the elasticity development within the pullback". So according to your definition, the pullback must meet Elasticity Rule, but I saw some chart examples with HH / LL Failure trades which do not meet this rule. Therefore I just asked to make sure if there must be elasticity between stochs for this type of trades....
Ignored
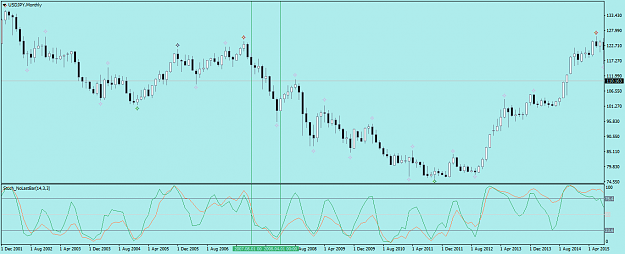
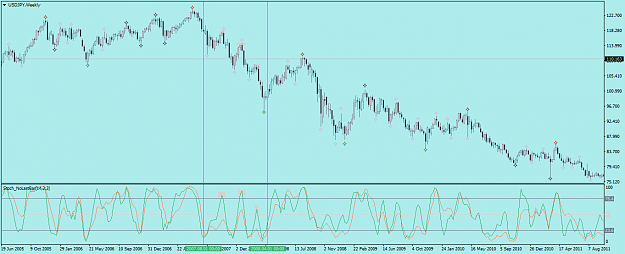
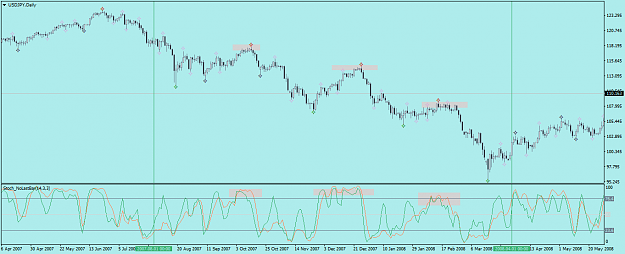
I use the higher TF cycles to base my trades. Please see the example. For the Monthly stoch bear cycle to complete we have three significant W1 elasticity setups that correspond to three D1 extreme OB stoch cycles. So yes when I see that I go for the trade on D1 without elasticty, the elasticity is traded cause its happening on W1 chart
On post #25, you wrote "I measure divergence according to the slower stoch 14 3 3 (red one) not the fast 5 3 3". On post #33, you wrote "You can spot the hidden divergence in any of the stochs but I prefer to see the divergence on the 5 3 3 the fastest one". You measure hidden divergence, without Elastic Divergence, on slower stoch 14 3 3, but when there is an Elastic Divergence, you prefer faster stoch 5 3 3 to spot hidden divergence. Would you please confirm if my understanding is correct? Thanks. Regards, Blackeagle
Markets is making more trade opportunities. Some more possible trades {image} {image} {image} {image} {image}
Ignored
Hi ghbdr,
Please let me know whether my understanding is correct or not.
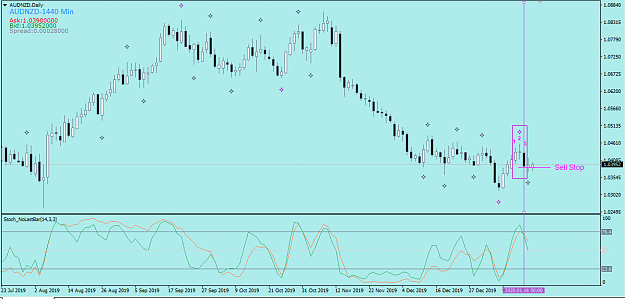
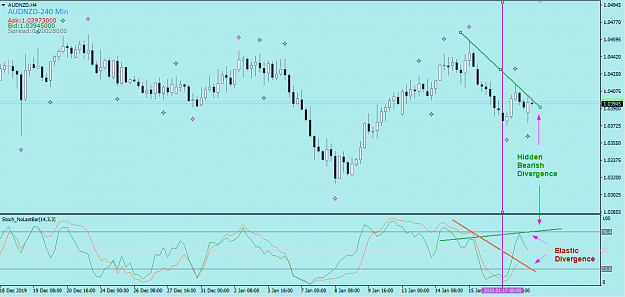
For AUDNZD, on D1, LH is confirmed with 1-2-3 candle V shape. Although there is only a slight elasticity on D1, but on H4, there is hidden (bearish) divergence. Therefore, it is still good to SELL. (Because there is Elastic Divergence on H4, we use faster stoch 5 3 3 (green stoch) to spot hidden divergence)
{quote} Hi ghbdr, Please let me know whether my understanding is correct or not. For AUDNZD, on D1, LH is confirmed with 1-2-3 candle V shape. Although there is only a slight elasticity on D1, but on H4, there is hidden (bearish) divergence. Therefore, it is still good to SELL. (Because there is Elastic Divergence on H4, we use faster stoch 5 3 3 (green stoch) to spot hidden divergence) {image} {image} Thanks,
Ignored
Its correct. I like to see the H4 slow stoch to make Lower Highs as is the case supported by the weekly elasticty with extreme OS stoch postion. Also the monthly stoch is pointing down so good short. The thing you need to consider is that when you see the weekly elasticty and D1stoch on the other extreme is possible that price will come back to test the recent high on D1 in the form of a elastic or classic divergence before going down and resume the W1 elasticity. So you should wide your stops to be prepared for that situation or trade without stops with the recovery system that has been provided in the thread before or any kind of grid money management approach. All of them will work for that particular case
{quote} Hi ghbdr, Please let me know whether my understanding is correct or not. For AUDNZD, on D1, LH is confirmed with 1-2-3 candle V shape. Although there is only a slight elasticity on D1, but on H4, there is hidden (bearish) divergence. Therefore, it is still good to SELL. (Because there is Elastic Divergence on H4, we use faster stoch 5 3 3 (green stoch) to spot hidden divergence) {image} {image} Thanks,
Ignored
HI,
So we look only to the purple arrows in this case?
BR
It is not important how often you fall down, but how often you get up again
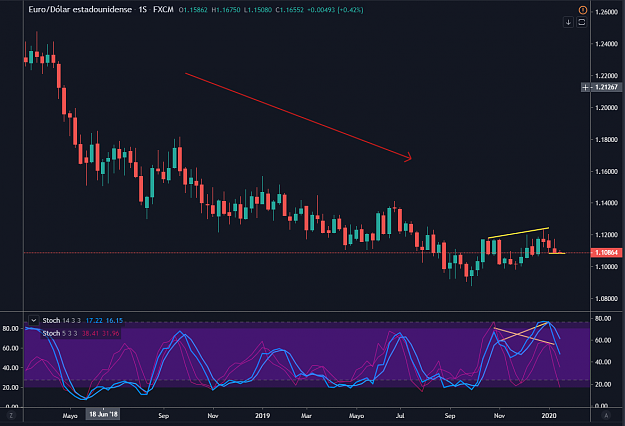
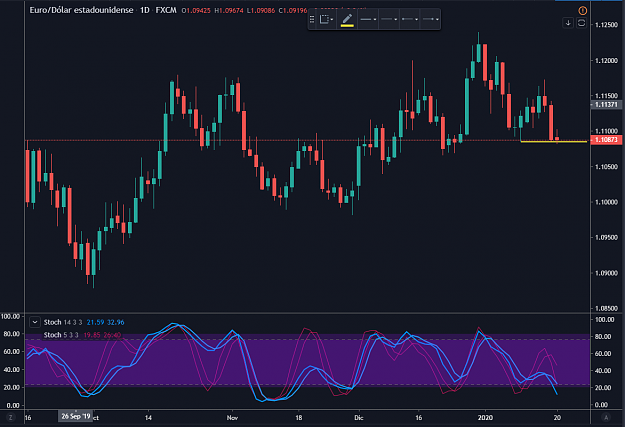
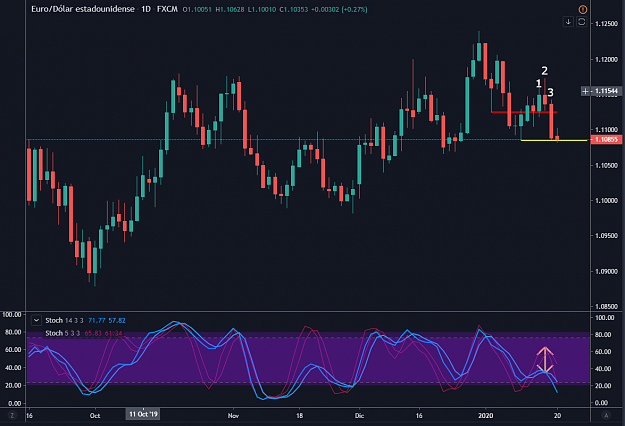
Hello ghbdr, correct me if I'm wrong please. Here's my analysis for EU. On the weekly chart we can see a downtrend and an Elastic and Hidden Divergence. On the daily chart we just broke the last swing low. Now we would have to wait for the pullback up, the V formation and elasticity or divs to take the short trade? Thanks! {image} {image}
Ignored
Yes. In fact you are late. You should take the last D1 elasticity short setup with HH failure