{quote} Mz, thanks, think it could still go further, got out of shorts for an opportunist profit, made enough, the rise making better entry for more, only my opinion, could be wrong, the question needs asking, what's driving this, sentiment now, but sentiment will not hold, the environment will put pay to that, only my opp, D
Ignored
All we can do is look to follow the momentum, hence why i am looking to see if it gets above the hard stops and can stay above it on retests to that area, then will begin buying, but if it just pops above the 59.41 level and comes back down then will look to continue shorting, that support from the D1 chart seems to be holding up quite well so a tussle may continue playing out next couple of days before a level either holds or folds....
Two zoomed out charts of the daily that shows the consolidation whenever price gets near this MA....some periods of consolidating before it decides on a way forward....
{quote} All we can do is look to follow the momentum, hence why i am looking to see if it gets above the hard stops and can stay above it on retests to that area, then will begin buying, but if it just pops above the 59.41 level and comes back down then will look to continue shorting, that support from the D1 chart seems to be holding up quite well so a tussle may continue playing out next couple of days before a level either holds or folds.... Two zoomed out charts of the daily that shows the consolidation whenever price gets near this MA....some...
Ignored
Understand to go with a flow, but (just me) think it could be drawing in, if the daily configuration was upside down it would look like a flag, probably main reason for me, all other reasons add to my thought, safe trading and great see your calls Mz, D
I don't need to be good at the game, only good enough to beat my opponent,
{quote} Understand to go with a flow, but (just me) think it could be drawing in, if the daily configuration was upside down it would look like a flag, probably main reason for me, all other reasons add to my thought, safe trading and great see your calls Mz, D
Ignored
Understood DT......Lets see what it does mate. You been getting some good setups aswell i see...keep em coming
{quote} Understood DT......Lets see what it does mate. You been getting some good setups aswell i see...keep em coming
Ignored
Thanks Mz, it's all just my view, could have had a little luck and a good wind, it's very slippery all round, I do value your posts as with others too, we all make a good teamD
I don't need to be good at the game, only good enough to beat my opponent,
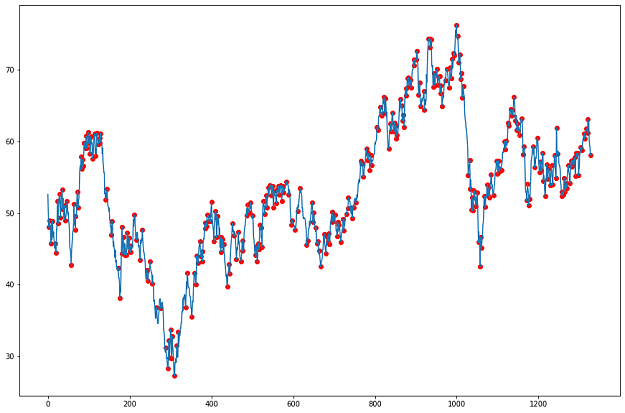
Below are the statistics of the average difference between peak points: Before removing outliers:
count 354.000000 (Number of samples)
mean 2.567655
std 1.910162
min 0.010000
25% 1.252500
50% 2.157500
75% 3.267500
max 12.435000
------------------------------------ After removing outliers:
count 334.000000
mean 2.250066
std 1.392702
min 0.010000
25% 1.184750
50% 2.037500
75% 3.120000
max 6.200000
----------------------------------------
Another plot to share from my trading system, is WTI closing price peak points: {image} Last 5 peaks: [59.14, 58.822, 61.12, 60.36, 61.761, 61.205, 63.074, 58.12 ] Below are the statistics of the average difference between peak points: Before removing outliers: count 354.000000 (Number of samples) mean 2.567655 std 1.910162 min 0.010000 25% 1.252500 50% 2.157500 75% 3.267500 max 12.435000 ------------------------------------ After removing outliers: count 334.000000 mean 2.250066 std 1.392702 min 0.010000 25% 1.184750 50% 2.037500 75% 3.120000 max...
Ignored
Keep posting great content champ!
persistence and determination alone are omnipotent
Another plot to share from my trading system, is WTI closing price peak points: {image} Last 8 peaks: [59.14, 58.822, 61.12, 60.36, 61.761, 61.205, 63.074, 58.12 ] Below are the statistics of the average difference between peak points: Before removing outliers: count 354.000000 (Number of samples) mean 2.567655 std 1.910162 min 0.010000 25% 1.252500 50% 2.157500 75% 3.267500 max 12.435000 ------------------------------------ After removing outliers: count 334.000000 mean 2.250066 std 1.392702 min 0.010000 25% 1.184750 50% 2.037500 75% 3.120000 max...
Ignored
MG, while a little over my head and not scared to admit, your posts are very informative, D
I don't need to be good at the game, only good enough to beat my opponent,
Another plot to share from my trading system, is WTI closing price peak points: {image} Last 8 peaks: [59.14, 58.822, 61.12, 60.36, 61.761, 61.205, 63.074, 58.12 ] Below are the statistics of the average difference between peak points: Before removing outliers: count 354.000000 (Number of samples) mean 2.567655 std 1.910162 min 0.010000 25% 1.252500 50% 2.157500 75% 3.267500 max 12.435000 ------------------------------------ After removing outliers: count 334.000000 mean 2.250066 std 1.392702 min 0.010000 25% 1.184750 50% 2.037500 75% 3.120000 max...
Ignored
Good to see some Python on the forum!
Self-sufficiency is the greatest of all wealth. - Epicurus