Due to popular demand I have exceeded 22.1 GB of downloads this last week, largely because of the Beck's Geometric Trading Course. Currently I'm close to exceeding my download limit, while there are a few more. Hum? Let me think about it? I've got to catch a flight do business and drive 732 miles back while you guys are comfortable at home with your bedroom slippers on...LOL
Remember:if you are not growing, you are dying. Think about it....
P
You NEVER will be the person you could be, without pressure & discipline
Christmas greetings and good luck on your business trip, I want to say; take it or leave it, you are my mentor as far as this industry is concerned, thank you once again Diamond Miner
Due to popular demand I have exceeded 22.1 GB of downloads this last week, largely because of the Beck's Geometric Trading Course. Currently I'm close to exceeding my download limit, while there are a few more. Hum? Let me think about it? I've got to catch a flight do business and drive 732 miles back while you guys are comfortable at home with your bedroom slippers on...LOL Remember: if you are not growing, you are dying. Think about it.... P
Due to popular demand I have exceeded 22.1 GB of downloads this last week, largely because of the Beck's Geometric Trading Course. Currently I'm close to exceeding my download limit, while there are a few more. Hum? Let me think about it? I've got to catch a flight do business and drive 732 miles back while you guys are comfortable at home with your bedroom slippers on...LOL Remember: if you are not growing, you are dying. Think about it.... P
Ignored
have a safe trip and wish you well for your business
{quote} Jonica200, normally I use Optuma Charting Software. You can get it through me https://optuma.com/UFM as they give me credit and I just buy additional tools in their toolset. But, once you use that software and use the tool-set to the fullest (using the Beck, Jenkins or Gann tool-set), it will have an affect upon your decision making process on Entry and Exit. You can never have enough Education. I know it cost money, but one thing I have learned long ago is: to be uneducated in any field, is the road to ruin. Trading is a business,...
Ignored
You are right DM, this is the real deal
Jenkins and Beck are practical geniuses (via exploration and effort to understand)
Theirs is the only material i have gone through twice/thrice/four times this year
Cheers!
PS: sorry for the silence, been in the 'basement' experimenting. Now catching up from page 42, awesome stuff.
{quote} That is fine, but if you want to do what one of the top traders in the world does to hone in on some of these levels he uses a calculation that stays with the currency. Find an impulse move ( not a news flash move). Divide the low by the high of that move to establish a ratio. Multiply the high (or the low in a reverse move) by the ratio to find the next level and mark the level. If broken do the same to establish the next expected area that will be challenged...or use the next level as a target to close etc. Do this on one of your favourite...
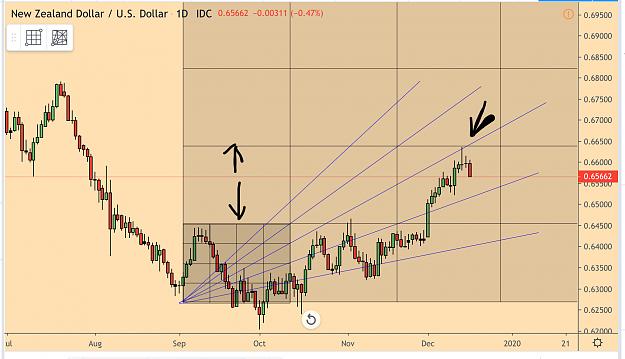
For my long term trades Jenkins recommends squaring the square from initial obvious impulse wave and I’m finding great opportunities when taking the time to do so. Also, less stress trying to catch those intraday trades that drive one nuts at times and especially of late with elections, major economic changes ( Brexit) , China talks and impeachment trials. Attached is just such a trade....easiest entry ever and all due to Jenkins methods and Diamond bringing his methods to us......have a safe holiday everyone, cu in the new year....have to catch some sun now here in SAN Jose del Cabo....Hyatt Ziva is a really great resort, been here before and still the same great service and people, highly recommend it...
For my long term trades Jenkins recommends squaring the square from initial obvious impulse wave and I’m finding great opportunities when taking the time to do so. Also, less stress trying to catch those intraday trades that drive one nuts at times and especially of late with elections, major economic changes ( Brexit) , China talks and impeachment trials. Attached is just such a trade....easiest entry ever and all due to Jenkins methods and Diamond bringing his methods to us......have a safe holiday everyone, cu in the new year....have to catch...
Ignored
Hi Swede, thanks for sharing. Just a question, isn't the impulse wave measured from the lowest point?
{quote} Hi Swede, thanks for sharing. Just a question, isn't the impulse wave measured from the lowest point? Btw, Happy Holidays.
Ignored
I looked at that but I used the first significant impulse wave after the big sell off.....that’s the one that set the stage for the potential reversal of trend....if you have a chance to read how Jenkins sets the box you will find very similar settings for his box...once it’s set in place you will see subsequent bar often move outside slightly...and then continue in the direction of the first significant wave....notice looking just right of the first wave used for the box how price bounced off the bottom many times offering long opportunities...
{quote} I looked at that but I used the first significant impulse wave after the big sell off.....that’s the one that set the stage for the potential reversal of trend....if you have a chance to read how Jenkins sets the box you will find very similar settings for his box...once it’s set in place you will see subsequent bar often move outside slightly...and then continue in the direction of the first significant wave....notice looking just right of the first wave used for the box how price bounced off the bottom many times offering long opportunities...
Ignored
Yes, I've seen this myself many times and it does work to a certain extent. Just that I can't find a logical reason to fit into a "rule based" initial impulse wave measurement.
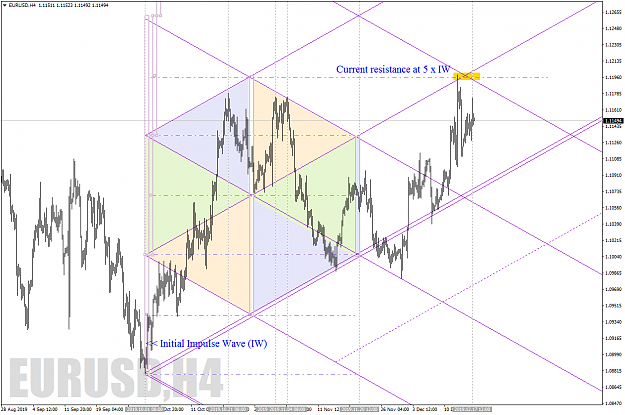
The EURUSD H4 grid based on an IW. Price resistance at 5 x IW and down-sloping diagonal from 8 x IW. Thanks to Jenkins for highlighting the importance of an IW and DM for his many sharing.
Edited.
The EURUSD H4 grid based on an IW. Price resistance at 5 x IW and down-sloping diagonal from 8 x IW. Thanks to Jenkins for highlighting the importance of an IW and DM for his many sharing. Edited. {image}
Ignored
dont recommend using 4hr charts for geometric work as brokers will have you believe there are thirty-one bars in a week and this will mess up counting, 1-hr or daily
For my long term trades Jenkins recommends squaring the square from initial obvious impulse wave and I’m finding great opportunities when taking the time to do so. Also, less stress trying to catch those intraday trades that drive one nuts at times and especially of late with elections, major economic changes ( Brexit) , China talks and impeachment trials. Attached is just such a trade....easiest entry ever and all due to Jenkins methods and Diamond bringing his methods to us......have a safe holiday everyone, cu in the new year....have to catch...
Ignored
What a life style, making a dollar in such surroundings.
Seasons greetings to you all.
The EURUSD H4 grid based on an IW. Price resistance at 5 x IW and down-sloping diagonal from 8 x IW. Thanks to Jenkins for highlighting the importance of an IW and DM for his many sharing. Edited. {image}
Ignored
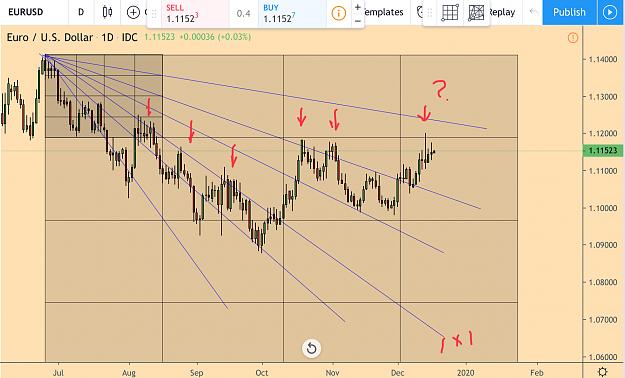
The reason I pretty much stay with daily (after analyzing the weekly) is it keeps your focus on the trend better (for me anyway) For example when I look at your 4 hour chart it can trick you into thinking Euro is heading into in an up trend...but when you look at the daily you get quite a different view...here again is the box and the extension boxes. The initial box was the high to low drawn from June 25 to July 9th. (Impulse wave down staying with the trend) Note how the 1x1 kept you into the down trend...and now resistance is in close view for more south..imho. I’m just showing what I have found useful for me, not criticizing your post at all.
a{quote} Swede the division of the Price Range interval by 8 (here 0-100) mimics closely and very simply the Fibonacci serie , which itself generates a parabolic curve {image} {image}
Ignored
This is gold PB, thanks! Have a few ideas based on this that i want to run on my charts, then give feedback
{quote} dont recommend using 4hr charts for geometric work as brokers will have you believe there are thirty-one bars in a week and this will mess up counting, 1-hr or daily
Ignored
Yes but isn't it true with all other timeframes except Weekly? Do you mind elaborating?
{quote} The reason I pretty much stay with daily (after analyzing the weekly) is it keeps your focus on the trend better (for me anyway) For example when I look at your 4 hour chart it can trick you into thinking Euro is heading into in an up trend...but when you look at the daily you get quite a different view...here again is the box and the extension boxes. The initial box was the high to low drawn from June 25 to July 9th. (Impulse wave down staying with the trend) Note how the 1x1 kept you into the down trend...and now resistance is in close...
Ignored
Nice one Swede... yes the higher timeframes hold the key. Weekly charts are powerful. I work with smaller timeframes most of the time.
No worries... [constructive] criticisms are always welcome.
as regards "scaling chart": 1) some years ago HWSTEEL's videos opened my mind 2) I read that the first retracement "normally"is the 45° 3) I studied a lot about pips and bars on metatrader
Ignored
What tool are you using to draw circles and 45° angles