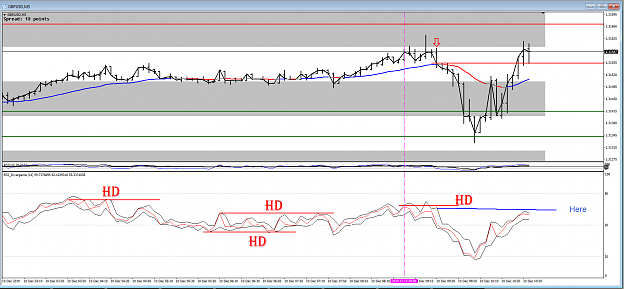
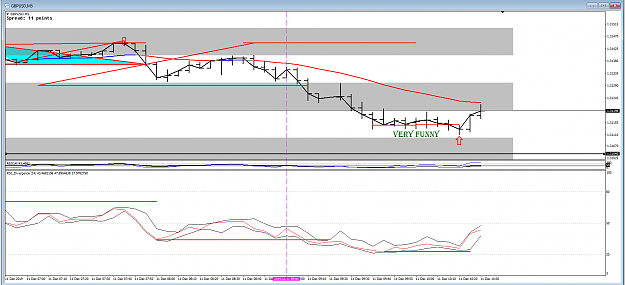
That Short was taken on H1 HD & M15 Div & M5 Div
The exit at M5 swing low.
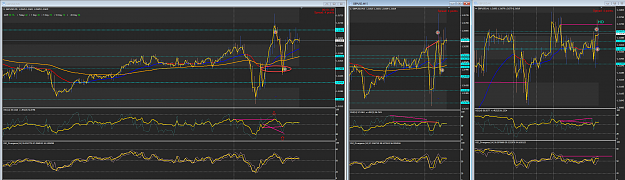
All okay so far.
Just that closing of the Short is basically a Buy.
Meaning I wanted to Buy.
And yes, it is a good Buy setup, not to say a great one.
Just.... I had to put money on it.
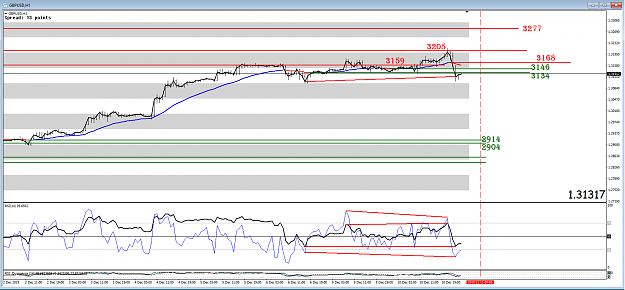
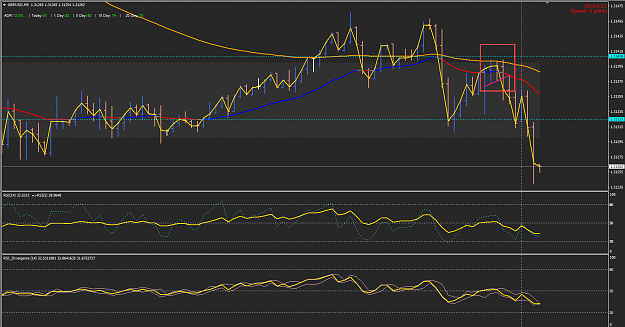
That took forever for the average to finally break the 3159 and of course price runs to the next level 3205 arriving there in an RSI div.
Unless the bears can make a LL average we would expect the next level to be the 3277 as the bulls make the HH average. Already the bears have run into trouble so I would be expecting a continuation to the long side, but at this stage that would be guess work.
That took forever for the average to finally break the 3159 and of course price runs to the next level 3205 arriving there in an RSI div. Unless the bears can make a LL average we would expect the next level to be the 3277 as the bulls make the HH average. Already the bears have run into trouble so I would be expecting a continuation to the long side, but at this stage that would be guess work. {image}
Ignored
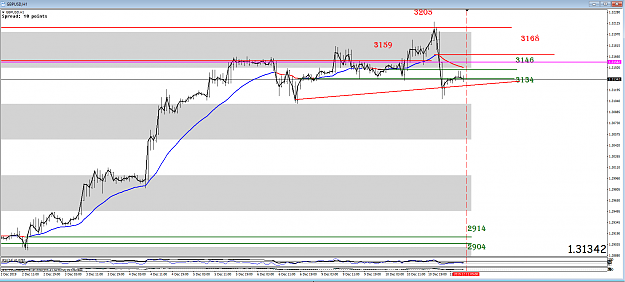
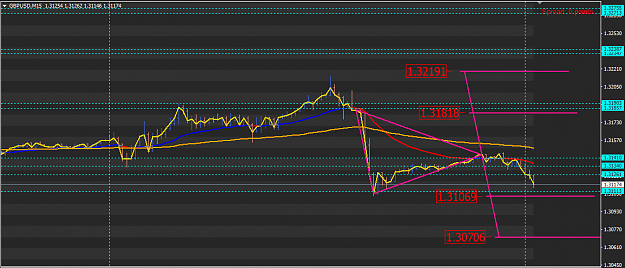
Instead of 1.3205 I have 1.3214 marked up. Which was the exact bounce.
I just checked that number in history and I think it is correct. Maybe you should check it too, so we have a good picture of what swings are doing?
I also have 3218 and 3225 and 1.3267 marked but those are no swing highs. Just a grey field between red and blue.
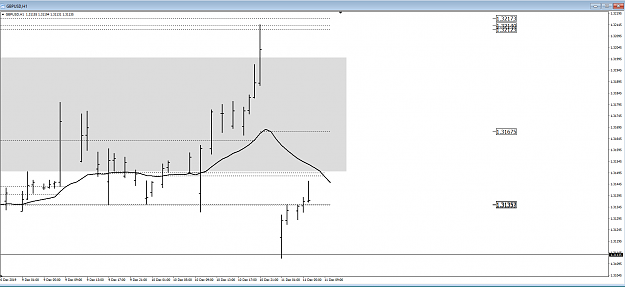
Regret always comes too late as we say here. I wanted to see price heading into the H1 EMA but the Bears didn't wait for that. The M30 EMA again was resistance.
The H1 EMA currently attacks yesterday's sideways level as Alan pointed.
M15 targets:
{quote} Instead of 1.3205 I have 1.3214 marked up. Which was the exact bounce. I just checked that number in history and I think it is correct. Maybe you should check it too, so we have a good picture of what swings are doing? I also have 3218 and 3225 and 1.3267 marked but those are no swing highs. Just a grey field between red and blue.
Ignored
Mine was just a close enough but when I blow the thing right up I can see you are correct but then I would have been looking at the 32123...1.5 pips difference hey!