Hi Alan,
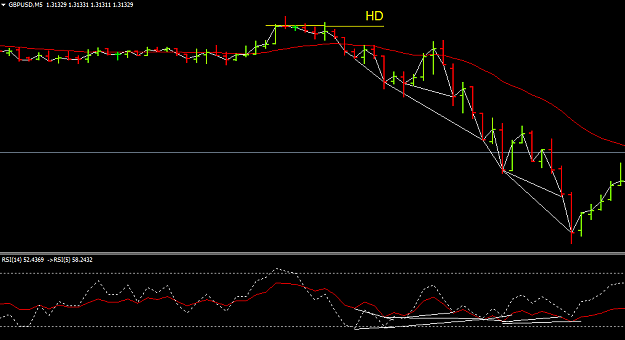
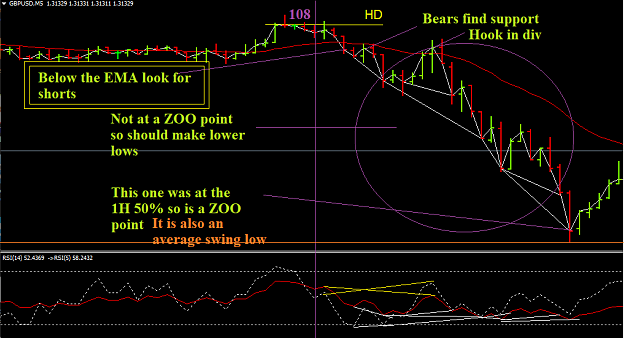
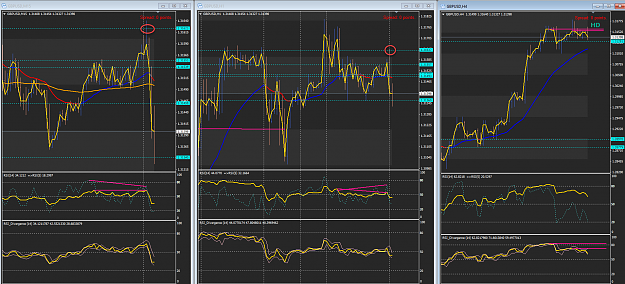
Thanks for your continuous support. I have a doubt regarding today's action. I get that Short is the way to go for today, as traded by you and probably Jazz1964. However, I'm confused about how we deal with these few bullish divergences along the way, as drawn in the picture. To me, this is one of the most confusing parts, as these types of situations happen pretty often. Please educate me.
Thanks for your continuous support. I have a doubt regarding today's action. I get that Short is the way to go for today, as traded by you and probably Jazz1964. However, I'm confused about how we deal with these few bullish divergences along the way, as drawn in the picture. To me, this is one of the most confusing parts, as these types of situations happen pretty often. Please educate me.
Attached Image (click to enlarge)