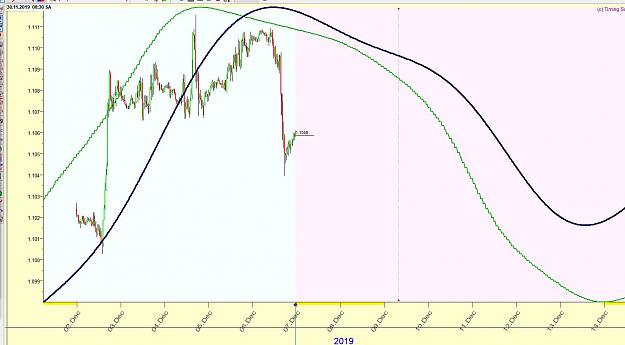
Disliked[quote = becks.200; 12449789] {quote} Cambio en la tendencia [/ quote] Thank you. I also have a bearish change at DJIA as of Wednesday. But then anything else will happen. I use Fourier transforms to verify my astrological predictions. I have them in an Excel sheet.Ignored
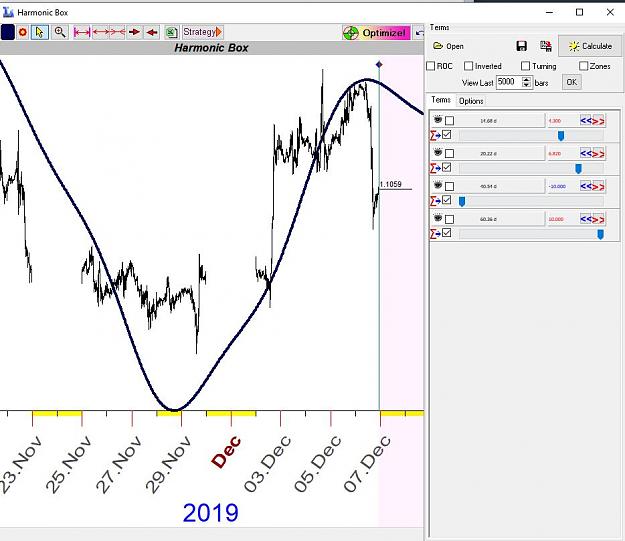
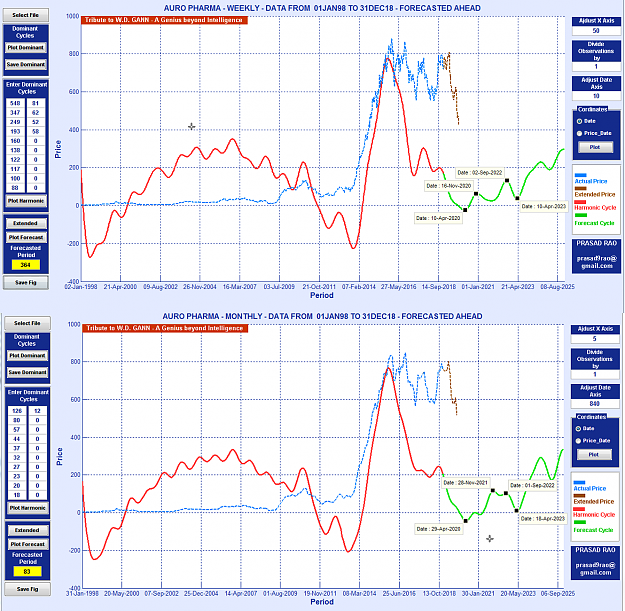
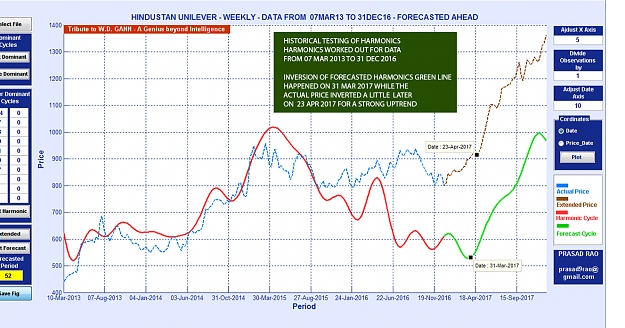
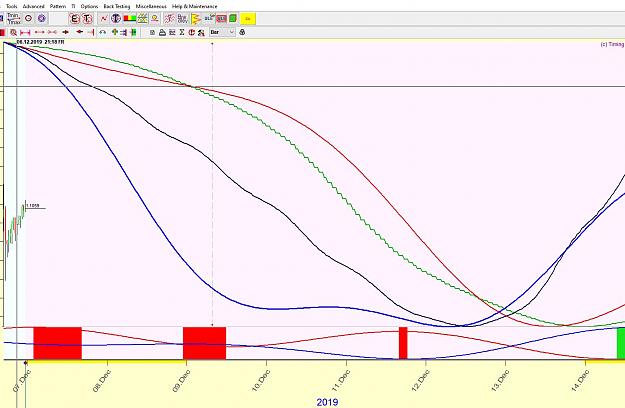
After exploring Gann and getting nothing no cycles from planets I tried Harmonic Analysis as shown by Awodele using Fourier Series.
I already shared it with Sir Parisboy.
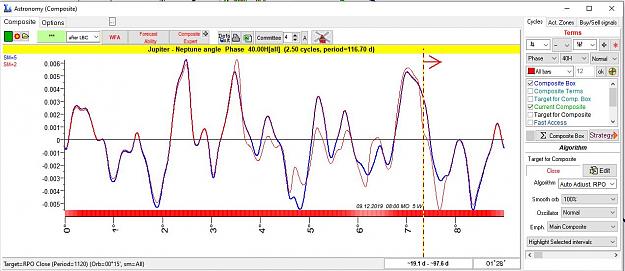
I may not be as knowledgeable as you all in this forum , but I have programmed somethings based on Fourier Seriers and testing it. Its purely based on mathematics. Its just a beginning to explore but might be pleased if some genius throws some more light on this for further improvements.
Attached Image(s) (click to enlarge)

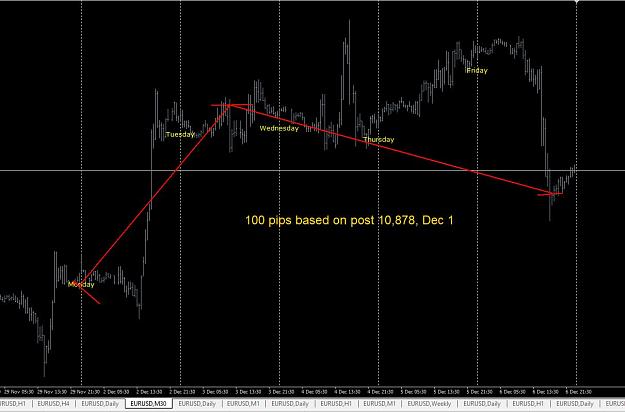
![Click to Enlarge
Name: 2019-12-07 21_55_38-2100063482_ Darwinex-Live - [EURUSD,M30].png
Size: 100 KB](/attachment/image/3505860/thumbnail?d=1575756668)