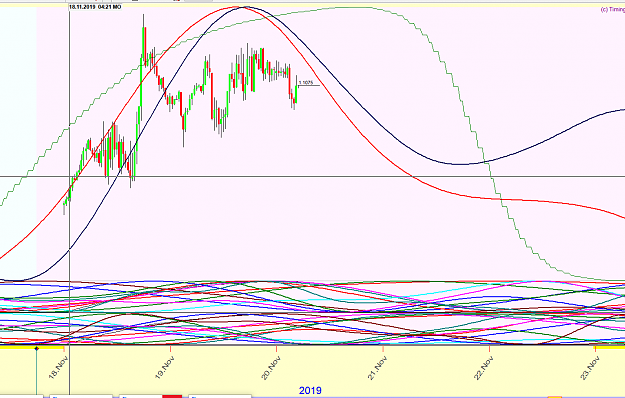
• Home
  • Forums
  • Trades
  • News
  • Calendar
  • Market
  • Brokers
  • Login
  • Join
  • User/Email: Password:
  • 2:45am
Menu
  • Forums
  • Trades
  • News
  • Calendar
  • Market
  • Brokers
  • Login
  • Join
  • 2:45am
Sister Sites
  • Metals Mine
  • Energy EXCH
  • Crypto Craft

Options

Bookmark Thread

First Page First Unread Last Page Last Post

Print Thread

Similar Threads

Planetary cycles, astrological theory of cycles of the markets 493 replies

Planetary / Astrology indicators 3 replies

Forecast Forex using Numeric Cycles and Astrology Cycles 32 replies

Planetary Cycles... Plotting Cycles into the Future 0 replies

Opinions on "Planetary cycles, astrological theory .. of the markets" 40 replies

  • Interactive Trading
  • /
  • Reply to Thread
  • Subscribe

Planetary Cycles Trading (EUR/USD)

  • Last Post
  •  
  • 1 541542Page 543544545 607
  • 1 Page 543 607
  •  
  • Post #10,841
  • Quote
  • Edited at 5:18pm Nov 17, 2019 11:06am | Edited at 5:18pm
  •  parisboy
  • Joined Oct 2017 | Status: Member | 5,232 Posts
Quoting Suryananda
Disliked
{quote} Please, a little seriousness! All these lines on the graphics are garbage that do not allow to see the price action. With an MA30 or MA60 is enough. Technical analysis is a fallacy that has never worked and will never work because it has no scientific basis. The person in the world who has studied patterns more is Bulkowski and statistically demonstrates that very few patterns are useful for trading. http://thepatternsite.com/at.html Bulkowski's Pattern Recognition Software_ http://thepatternsite.com/patternz.html ....
Ignored
I do not care about your opinion.

You are a stupid stubborn guy systematically agressing other posters using other methodologies that you systematically denigrate.

Nobody here use your method (that nobody on this thread denigrate and that you are free to use)

As for astrology I do not use it for trading and investing. This methodology known as "Financial Astrology" is not fit for me. It does not "talk " to me, as some Technical Analysis tools do not "talk" to me also

My opinion on "Financial Astrology" is :

a) Surya is too short-sighted to understand that Financial astrology it is too complicated for a newbie. It seems easier to turn an "astrologer" into a trader than a trader into a Financial astrologer
b) Surya is too short-sighted to understand that no newbie can choose between Solar Astrology, Heliocentric Astrology, Vedic Astrology etc
c) Surya is too short-sighted to understand that Financial Astrology is not "progressive" meaning you can go step by step from the simplest tool or methodology to the most complex and generate some positive results.

This explains why many traders have a look on the subject (it is interesting and stimulating) but very few of them use Financial astrology for trading, investing or forecasting.
  • Post #10,842
  • Quote
  • Nov 17, 2019 11:19am Nov 17, 2019 11:19am
  •  OnlineAddict
  • Joined May 2014 | Status: Veteran | 7,569 Posts
Quoting Suryananda
Disliked
Technical analysis is a fallacy that has never worked and will never work because it has no scientific basis.
Ignored
So astrology trading has a scientific basis?

If you don't respect and understand technical analysis, its clear you are just a charlatan.
If less is more, just think how much more more will be.
  • Post #10,843
  • Quote
  • Nov 17, 2019 10:14pm Nov 17, 2019 10:14pm
  •  dorood
  • Joined Jun 2019 | Status: Member | 74 Posts
Quoting OnlineAddict
Disliked
{quote} So astrology trading has a scientific basis? If you don't respect and understand technical analysis, its clear you are just a charlatan.
Ignored
You do not have any positive presentation in this thread.
What do you want here.
Suryananda has some good and some bad ideas.
We appreciate him for his good and helpful ideas.
Leave us.
1
  • Post #10,844
  • Quote
  • Nov 18, 2019 12:27am Nov 18, 2019 12:27am
  •  jnevins
  • Joined Feb 2007 | Status: Member | 2,113 Posts
Alternate outlook... I put the Jupiter-Neptune 40h line back to normal in spite of the upcoming sun entering Sag. My reasoning is in looking at that configuration as the week ended last week (Image 2). The last 3 hours of Friday saw a drop but that isn't enough time to need to reverse and invert the Jup-Nep curve... Time will tell...
Attached Images (click to enlarge)
Click to Enlarge

Name: Capture.PNG
Size: 14 KB Click to Enlarge

Name: Capture1.PNG
Size: 55 KB
1
  • Post #10,845
  • Quote
  • Edited at 7:23am Nov 18, 2019 6:41am | Edited at 7:23am
  •  Suryananda
  • Joined Nov 2010 | Status: Member | 623 Posts
Today there was no movement. At least we have not lost money. Tomorrow may be better.
Best wishes to All.

EURUSD 18-11-2019. BUY 08:10 AM to 11:41 AM. Chart 1D.
Attached Image (click to enlarge)
Click to Enlarge

Name: 2019-11-18 11_36_15-Window.png
Size: 51 KB

.
  • Post #10,846
  • Quote
  • Nov 18, 2019 7:04am Nov 18, 2019 7:04am
  •  Suryananda
  • Joined Nov 2010 | Status: Member | 623 Posts
Quoting parisboy
Disliked
{quote} I do not care about your opinion. You are a stupid stubborn guy systematically agressing other posters using other methodologies that you systematically denigrate. Nobody here use your method (that nobody on this thread denigrate and that you are free to use) As for astrology I do not use it for trading and investing. This methodology known as "Financial Astrology" is not fit for me. It does not "talk " to me, as some Technical Analysis tools do not "talk" to me also My opinion on "Financial Astrology" is : a) Surya is too short-sighted...
Ignored
Any type of analysis that lacks statistical verification is a hoax for ignorant people. The worst part is that there are many people who fool themselves with their supposed analyzes. How many statistics have you made? Can you show us the statistical studies on which you base your predictions?

.
  • Post #10,847
  • Quote
  • Nov 18, 2019 7:18am Nov 18, 2019 7:18am
  •  Suryananda
  • Joined Nov 2010 | Status: Member | 623 Posts
Quoting dorood
Disliked
{quote} You do not have any positive presentation in this thread. What do you want here. Suryananda has some good and some bad ideas. We appreciate him for his good and helpful ideas. Leave us.
Ignored
Astrology is completely modelable through statistics. That provides a great advantage. But doing statistics gives a huge job.

I started doing Technical Analysis statistics about 20 years ago and ended up in astrology because it is much more profitable. My work is always statistical. W.D. Gann had no pc to do scientific astrology. We can.

Bulkowski's statistical work is extremely useful. Because it shows in depth what can be expected from the technical analysis.
http://thepatternsite.com/patternz.html

Regards
.
  • Post #10,848
  • Quote
  • Edited at 9:01am Nov 19, 2019 8:43am | Edited at 9:01am
  •  parisboy
  • Joined Oct 2017 | Status: Member | 5,232 Posts
difference between statistics talkers and statistics researchers on Waves and Patterns

hereunder an exceptional methodology on how to classify patterns and weigh their effectiveness

Waves Statistics generating repeating Patterns are the end result of a study analyzing 29 millions + EURUSD ticks
Attached File
File Type: pdf FOREX WAVE THEORY.pdf   5.9 MB | 279 downloads
  • Post #10,849
  • Quote
  • Nov 19, 2019 8:45am Nov 19, 2019 8:45am
  •  parisboy
  • Joined Oct 2017 | Status: Member | 5,232 Posts
About Bulkowski
Attached File
File Type: pdf Encyclopedia Of Chart Patterns, 2nd Edition by Thomas N. Bulkowski.pdf   7.6 MB | 412 downloads
  • Post #10,850
  • Quote
  • Nov 19, 2019 10:53am Nov 19, 2019 10:53am
  •  Suryananda
  • Joined Nov 2010 | Status: Member | 623 Posts
Quoting Suryananda
Disliked
Prediction EURUSD: IF EURUSD 1D Chart Price>EMA60 and 18/11/2019 08:10 to 12:17 UTC, BUY 19/11/2019 06:05 to 11:51 UTC, BUY otherwise outside. Mundane Chart. London UTC. Ayamansa Lahiri. Venus House 1 Scorpio and Mars in Libra. Mutual Reception. Jupiter House 1 in Saggitarius. Own regency. Part of Fortune House 9 in Cancer. Regent the Moon. Moon House 9 in Cancer. Own regency. This set is very bullish as long as the price remains above the EMA 60 in 1D chart. Profit statistical factor 2.35. On the days and times indicated. {image} {image}
Ignored
Results of the prediction made on Post 10,840, Nov 17, 2019 5:46 for the EURUSD.

Prediction EURUSD:
IF EURUSD 1D Chart Price>EMA60 and
18/11/2019 08:10 to 12:17 UTC, BUY.................+2,2
19/11/2019 06:05 to 11:51 UTC, BUY.................+2,6
Total...............................................................+4,8 pips
Four pips is nothing. Lack of market trend.

EURUSD 1D Today
Attached Image (click to enlarge)
Click to Enlarge

Name: 2019-11-19 15_39_34-Window.png
Size: 103 KB

.
1
  • Post #10,851
  • Quote
  • Nov 20, 2019 3:53am Nov 20, 2019 3:53am
  •  Student1440
  • | Joined Sep 2019 | Status: Member | 32 Posts
Hi I am trying to ascertain the underlying trend of the market according to planetary transits and aspects to the natal chart . The stock I am looking at is National Australia Bank which was listed the Exchange on the 12th September 1991 at approx 10.00am . As I do not have the exact time and location of listing I have set the listing time for 10.00am which is a stable point to construct a horoscope . For the point of the exercise I have selected one intermediate price swing with Main Top 7th March 2019 and Main Low April 9th with a minor swing between 27th March to 2nd April . A duration of 33 Degrees .
At Top the Sun is sextile Natal Neptune conjunct North Node . Benefic aspect . Venus is 7 Deg Aquarius trine Natal Mars 7 Deg Libra then Mars is 14 Deg Taurus trine Natal conjunction North Node and Neptune 15 Deg Capricorn so at top of the market we have one sextile and two trine aspects to Natal Chart which appear to have coincided with the Top . In the Natal Chart Mercury is the Prime Significator however at the Top of the Market there are no aspects to Mercury.
Sepherial indicated that a depression in the securities occurs when there is a succession of malfeic aspects to the Prime Sigificator so for the point of this exercise I am examining and studying aspects and transits to The Natal Chart which may give directional indication of trend within the 33 Deg Time Period .

Following the Top on the 7th March 2019 the next aspect came in on the 14th March with Mars 19 Deg Taurus trine Natal Sun 19 Deg Virgo . A Benefic aspect to Natal and trend continued down. 18th March Venus 20 Deg Aquarius 180 Deg or opposite Natal Venus 20 Deg Leo then mars 21 Deg Taurus 90 Deg or square Natal Venus 20 Deg Leo . A Malfeic aspect which could have underpinned continuation of downtrend . 20th March Mercury 19 Deg Pisces opposite Sun 19 Deg Virgo . Downtrend continues .
27th March has two planetary aspects coinciding with a minor low before resumption of downtrend into 9th April Low . On the 27th March sun 6 Deg Aries 51" applying to opposition Natal Mars 7 Deg Libra then Venus 1 Deg Pisces seperating from opposition Natal Jupiter and applying to opposition Natal Mercury at 2 Deg Virgo the Prime Significator in the Natal . The Final Low came in on the 9th April 2019 where a significant Trine aspect occurred with Mars at 6 Deg Gemini applying to to Natal Mars at 7 Deg Libra which marked The Low . Sometimes when you line the Natal Chart up with significant Tops and Bottoms in the underlying Security a mix of signals will present themselves where Tops may coincide with Favourable Trine aspects and Bottoms will be Marked by opposition aspects and vice versa so sometimes you are presented with several conflicting signal's when matching Tops and Bottoms against The Fixed position of The Natal Chart but once price action moves into the Turning Date and aligns with other factors it becomes clear whether expect that point to be High or Low
1
  • Post #10,852
  • Quote
  • Nov 20, 2019 7:26am Nov 20, 2019 7:26am
  •  Suryananda
  • Joined Nov 2010 | Status: Member | 623 Posts
Quoting Student1440
Disliked
Hi I am trying to ascertain the underlying trend of the market according to planetary transits and aspects to the natal chart . The stock I am looking at is National Australia Bank which was listed the Exchange on the 12th September 1991 at approx 10.00am . As I do not have the exact time and location of listing I have set the listing time for 10.00am which is a stable point to construct a horoscope . For the point of the exercise I have selected one intermediate price swing with Main Top 7th March 2019 and Main Low April ...
Ignored
Can you upload the natal chart?
.
  • Post #10,853
  • Quote
  • Nov 21, 2019 6:00pm Nov 21, 2019 6:00pm
  •  googlefx007
  • | Joined Nov 2019 | Status: Member | 11 Posts
Quoting jnevins
Disliked
Alternate outlook... I put the Jupiter-Neptune 40h line back to normal in spite of the upcoming sun entering Sag. My reasoning is in looking at that configuration as the week ended last week (Image 2). The last 3 hours of Friday saw a drop but that isn't enough time to need to reverse and invert the Jup-Nep curve... Time will tell... {image} {image}
Ignored

Thank you for this. Can you tell me how long you have been doing this? I always see your charts in this thread.
  • Post #10,854
  • Quote
  • Edited Nov 22, 2019 12:06pm Nov 21, 2019 11:28pm | Edited Nov 22, 2019 12:06pm
  •  jnevins
  • Joined Feb 2007 | Status: Member | 2,113 Posts
Quoting googlefx007
Disliked
{quote} Thank you for this. Can you tell me how long you have been doing this? I always see your charts in this thread.
Ignored

I started working with Omega Research software in the late 90's and began with Forex around 15 years ago... I have been a FF member since 2007 and been posting weekly outlooks using Timing Solution software since Aug. 2015... https://www.forexfactory.com/showthr...08462&page=320

Update.. I have TS charts posted in 2013 https://www.forexfactory.com/showthr...86#post6809286
1
  • Post #10,855
  • Quote
  • Nov 22, 2019 11:48am Nov 22, 2019 11:48am
  •  irfanlodhi
  • Joined Jun 2016 | Status: Member | 11 Posts
Quoting jnevins
Disliked
{quote} I started working with Omega Research software in the late 90's and began with Forex around 15 years ago... I have been a FF member since 2007 and been posting weekly outlooks using Timing Solution software since Aug. 2015... https://www.forexfactory.com/showthr...08462&page=320
Ignored
Gr8 anyalise
  • Post #10,856
  • Quote
  • Nov 22, 2019 2:13pm Nov 22, 2019 2:13pm
  •  googlefx007
  • | Joined Nov 2019 | Status: Member | 11 Posts
Quoting jnevins
Disliked
{quote} I started working with Omega Research software in the late 90's and began with Forex around 15 years ago... I have been a FF member since 2007 and been posting weekly outlooks using Timing Solution software since Aug. 2015... https://www.forexfactory.com/showthr...08462&page=320 Update.. I have TS charts posted in 2013 https://www.forexfactory.com/showthr...86#post6809286
Ignored
Would you mind talking about your overall experience and returns? Very keen to really get involved in this.
  • Post #10,857
  • Quote
  • Nov 22, 2019 2:50pm Nov 22, 2019 2:50pm
  •  jnevins
  • Joined Feb 2007 | Status: Member | 2,113 Posts
Quoting googlefx007
Disliked
{quote} Would you mind talking about your overall experience and returns? Very keen to really get involved in this.
Ignored
Sure... first, here is a chart I ran on Tuesday but didn't post here... the area in pink is invisible to the program. (Timing Solution).

I have been posting predictions and then follow up recaps since 2015 each week as a research project. Attached is a partial accounting of that work beginning in March 2016 and ending on Sept 15, 2018.. I still need to finish the accounting and bring it up to the present. Each prediction is linked in the document. The main challenge to me has been to try and understand when an inversion might occur and prepare for it in advance.... I am making some progress but have not yet fully come to terms with the issue. My results mostly show an inversion around the time the sun enters a new house.
Attached Image (click to enlarge)
Click to Enlarge

Name: Capture.PNG
Size: 64 KB
Attached File
File Type: docx Compilation of predictions posted to Planetary Cycles Trading.docx   34 KB | 151 downloads
2
  • Post #10,858
  • Quote
  • Nov 22, 2019 6:12pm Nov 22, 2019 6:12pm
  •  jnevins
  • Joined Feb 2007 | Status: Member | 2,113 Posts
End of the week recap: 102 pips based post 10,831, Nov 15.
Attached Image (click to enlarge)
Click to Enlarge

Name: Capture.PNG
Size: 37 KB
1
  • Post #10,859
  • Quote
  • Nov 23, 2019 6:06am Nov 23, 2019 6:06am
  •  frenchkiss
  • | Joined May 2017 | Status: Member | 6 Posts
Quoting jnevins
Disliked
...and another series.... I added a nice oscillator to help determine the direction to trade... it was recently posted by Mladen... average daily win was 25 pips... When vertical line is placed 3 bars after Moon-Venus turn if the RSX is high, go short, if low, go long. {image} {file}
Ignored
Hello Jnevins , I'm a beginner in astro trading do you have some settings in this day for planet cycles indicator, in order to trade high volatile forex pair like GBPJPY GBPUSD or GBPAUD... with this fantastic system? thanks for all.
  • Post #10,860
  • Quote
  • Nov 23, 2019 11:32am Nov 23, 2019 11:32am
  •  santoso_am
  • | Joined Sep 2010 | Status: Member | 76 Posts
#ZieL #ZieLtime
document research purpose only
Attached Image (click to enlarge)
Click to Enlarge

Name: IMG_20191123_232358.jpg
Size: 99 KB
  • Interactive Trading
  • /
  • Planetary Cycles Trading (EUR/USD)
  • Reply to Thread
    • 1 541542Page 543544545 607
    • 1 Page 543 607
1 trader viewing now
  • More
Top of Page
  • Facebook
  • Twitter
About FF
  • Mission
  • Products
  • User Guide
  • Media Kit
  • Blog
  • Contact
FF Products
  • Forums
  • Trades
  • Calendar
  • News
  • Market
  • Brokers
  • Trade Explorer
FF Website
  • Homepage
  • Search
  • Members
  • Report a Bug
Follow FF
  • Facebook
  • Twitter

FF Sister Sites:

  • Metals Mine
  • Energy EXCH
  • Crypto Craft

Forex Factory® is a brand of Fair Economy, Inc.

Terms of Service / ©2021