• Home
  • Forums
  • Trades
  • News
  • Calendar
  • Market
  • Brokers
  • Login
  • Join
  • User/Email: Password:
  • 11:13am
Menu
  • Forums
  • Trades
  • News
  • Calendar
  • Market
  • Brokers
  • Login
  • Join
  • 11:13am
Sister Sites
  • Metals Mine
  • Energy EXCH
  • Crypto Craft

Options

Bookmark Thread

First Page First Unread Last Page Last Post

Print Thread

Similar Threads

Broker Challenge "NDD/STP" vs. True "ECN" and "Mkt Mkr" broker talk 46 replies

Dealing with "Invalid Price", "Requote", "Server Busy" in MT4 3 replies

Day Trader n Scalping with PA+SnR+SnD [Newbie Journal Trade] 40 replies

Please suggest a simple & effective Method/System of "Trading System" Forum to newbie 176 replies

"Bagovino Method" VS "Cornflower Hourly System" 16 replies

  • Trading Journals
  • /
  • Reply to Thread
  • Subscribe
  • 27
Attachments: QM/SnD Price Action "System"
Exit Attachments
Tags: QM/SnD Price Action "System"
Cancel

QM/SnD Price Action "System"

  • Last Post
  •  
  • Page 1 2
  • Page 1 2
  •  
  • Post #1
  • Quote
  • First Post: Nov 16, 2019 5:11am Nov 16, 2019 5:11am
  •  Pipsometer
  • | Joined Mar 2019 | Status: Member | 63 Posts
This thread has been opened for two reasons. First is to share my naked charts for the consumption of people on this platform and second, perhaps more importantly, to have a library of some sort where I can store my set-ups for potential trades.

Please if you must make a comment, be civil.

Thanks and best of luck.
  • Post #2
  • Quote
  • Nov 16, 2019 5:18am Nov 16, 2019 5:18am
  •  Pipsometer
  • | Joined Mar 2019 | Status: Member | 63 Posts
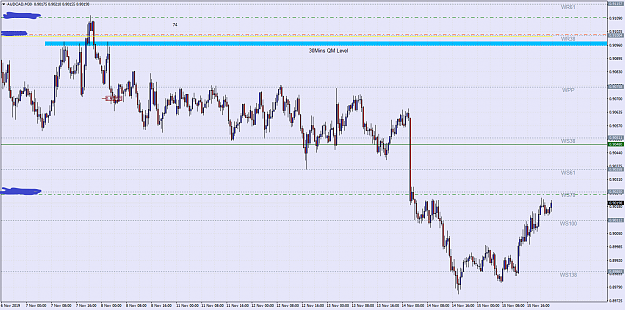
AUDCAD 30 Mins. Short at 0.9096
Attached Image (click to enlarge)
Click to Enlarge

Name: AUDCADM30.png
Size: 52 KB
 
 
  • Post #3
  • Quote
  • Nov 16, 2019 5:27am Nov 16, 2019 5:27am
  •  Pipsometer
  • | Joined Mar 2019 | Status: Member | 63 Posts
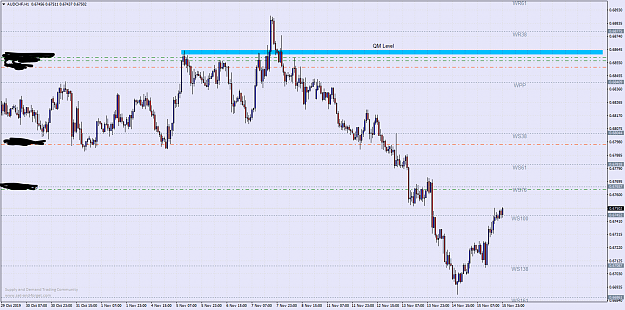
AUDCHF 30Mins. Quasimodo Level at 0.6860. Possible Short. Sell limit at that level
Attached Image (click to enlarge)
Click to Enlarge

Name: AUDCHFH1.png
Size: 57 KB
 
 
  • Post #4
  • Quote
  • Nov 16, 2019 5:32am Nov 16, 2019 5:32am
  •  Pipsometer
  • | Joined Mar 2019 | Status: Member | 63 Posts
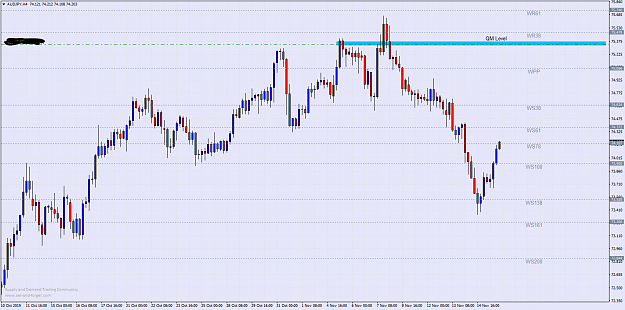
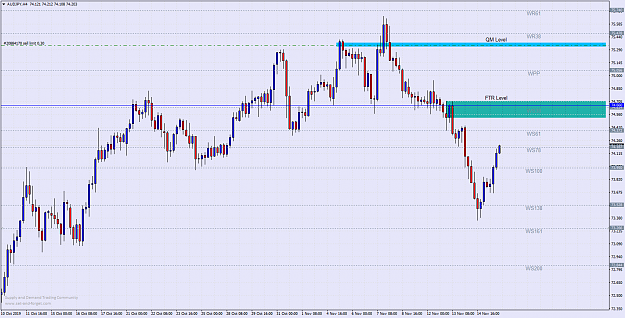
AUDJPY H4. Sell Limit at 75.31
Attached Image (click to enlarge)
Click to Enlarge

Name: AUDJPYH4.png
Size: 49 KB
 
1
  • Post #5
  • Quote
  • Edited 6:53am Nov 16, 2019 5:42am | Edited 6:53am
  •  3ka
  • | Joined Apr 2019 | Status: Member | 36 Posts
Quoting Pipsometer
Disliked
This thread has been opened for two reasons. First is to share my naked charts for the consumption of people on this platform and second, perhaps more importantly, to have a library of some sort where I can store my set-ups for potential trades. Please if you must make a comment, be civil. Thanks and best of luck.
Ignored
Nice, i'm personally start again learn price action.
how you draw that level?
 
 
  • Post #6
  • Quote
  • Nov 16, 2019 8:00am Nov 16, 2019 8:00am
  •  Pipsometer
  • | Joined Mar 2019 | Status: Member | 63 Posts
Quoting 3ka
Disliked
{quote} Nice, i'm personally start again learn price action. how you draw that level?
Ignored
These levels are called Quasimodo Levels. When combined with supply and demand, they work quite well and allow very good risk:reward
 
 
  • Post #7
  • Quote
  • Nov 16, 2019 8:02am Nov 16, 2019 8:02am
  •  Pipsometer
  • | Joined Mar 2019 | Status: Member | 63 Posts
AUDNZD 4Hour. This QM level worked before and should easily work again.
Sell at 1.08039.
Attached Image (click to enlarge)
Click to Enlarge

Name: AUDNZDH4.png
Size: 60 KB
 
 
  • Post #8
  • Quote
  • Nov 16, 2019 8:16am Nov 16, 2019 8:16am
  •  Pipsometer
  • | Joined Mar 2019 | Status: Member | 63 Posts
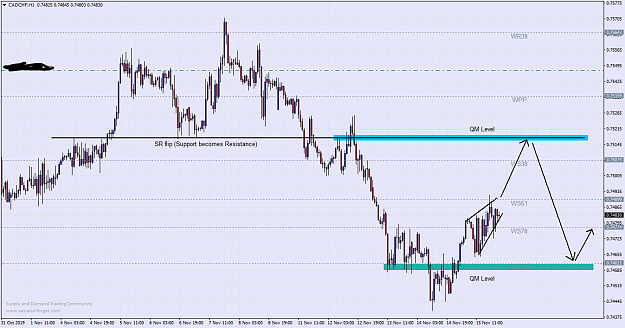
CADCHF 1Hour. Blue QM level is at a significant level where we had support become resistance. Sell limit at 7514.
Green QM level also good for longs. The arrows indicate how I expect the moves to play out. More important are the marked zones.
Attached Image (click to enlarge)
Click to Enlarge

Name: CADCHFH1.png
Size: 48 KB
 
1
  • Post #9
  • Quote
  • Nov 16, 2019 8:38am Nov 16, 2019 8:38am
  •  rosspetX
  • | Joined Jul 2017 | Status: Member | 103 Posts
Quoting Pipsometer
Disliked
AUDJPY H4. Sell Limit at 75.31 {image}
Ignored
Hi Pipsometer,
Thanks for initiating this thread. It would be indeed great to have some discussion on nude charts.
Could you please expand a little bit more on the QM levels. How do you come to decide where they are? For example, how did you choose the level of 75.31 for the AUDJPY?
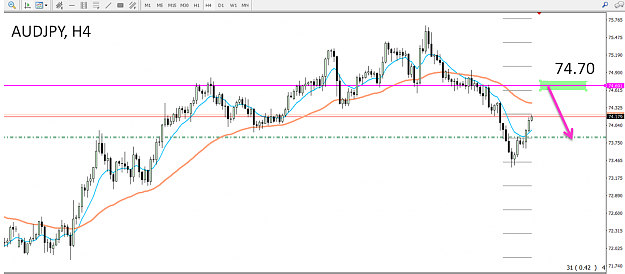
I am looking at the chart and I am thinking that the level 74.70 has touched a lot more resistance/support points and may/should stop AUDJPY from going further up...
What do you think about this possibility? It would be great to see your thoughts. Tnx.

Attached Image (click to enlarge)
Click to Enlarge

Name: AUD.JPY.png
Size: 103 KB
 
 
  • Post #10
  • Quote
  • Nov 16, 2019 8:38am Nov 16, 2019 8:38am
  •  Pipsometer
  • | Joined Mar 2019 | Status: Member | 63 Posts
OIL H4.
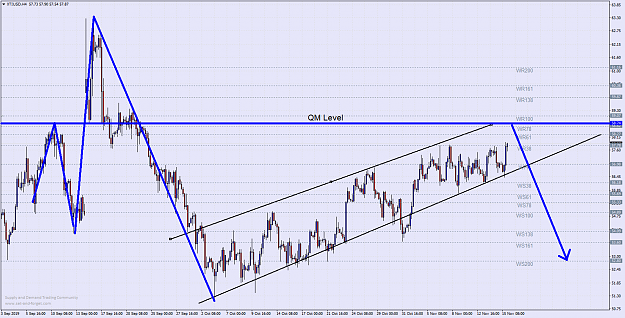
Very close to the QM Level. Great place to short. Putting a sell limit at 58.6.
Attached Image (click to enlarge)
Click to Enlarge

Name: XTIUSDH4.png
Size: 97 KB
 
 
  • Post #11
  • Quote
  • Nov 16, 2019 8:56am Nov 16, 2019 8:56am
  •  Pipsometer
  • | Joined Mar 2019 | Status: Member | 63 Posts
Quoting rosspetX
Disliked
{quote} Hi Pipsometer, Thanks for initiating this thread. It would be indeed great to have some discussion on nude charts. Could you please expand a little bit more on the QM levels. How do you come to decide where they are? For example, how did you choose the level of 75.31 for the AUDJPY? I am looking at the chart and I am thinking that the level 74.70 has touched a lot more resistance/support points and may/should stop AUDJPY from going further up... What do you think about this possibility? It would be great to see your thoughts. Tnx. {image}...
Ignored
Thanks for your post. I will be sharing a graphic on the QM levels and how to spot them soon probably today.

You are right that there is a decent chance that we may have a reversal at around 74.7. I have marked the level at 74.66 where we had a SR flip and the origin of the second downmove. Plus there is a FTR and supply zone which have a good chance of sending price down. So I think shorts at 74.7 are in order. I like and prefer to trade the most extreme levels as much as possible and I have had a lot of success with QM levels and they are my favorite.
Attached Image (click to enlarge)
Click to Enlarge

Name: AUDJPYH4sub.png
Size: 75 KB
 
 
  • Post #12
  • Quote
  • Nov 16, 2019 8:57am Nov 16, 2019 8:57am
  •  Godblesslzl
  • | Joined Oct 2019 | Status: Member | 20 Posts
Quoting Pipsometer
Disliked
OIL H4. Very close to the QM Level. Great place to short. Putting a sell limit at 58.6. {image}
Ignored
could you please say some more about QM levels?
 
 
  • Post #13
  • Quote
  • Nov 16, 2019 9:57am Nov 16, 2019 9:57am
  •  Pipsometer
  • | Joined Mar 2019 | Status: Member | 63 Posts
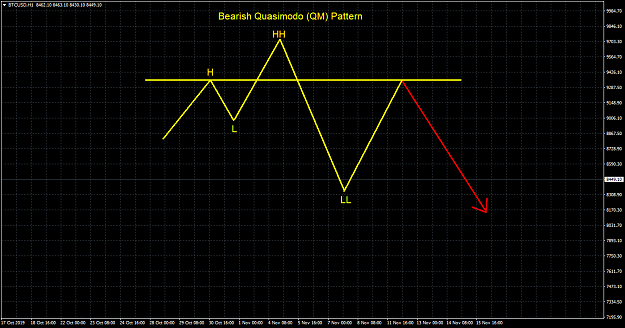
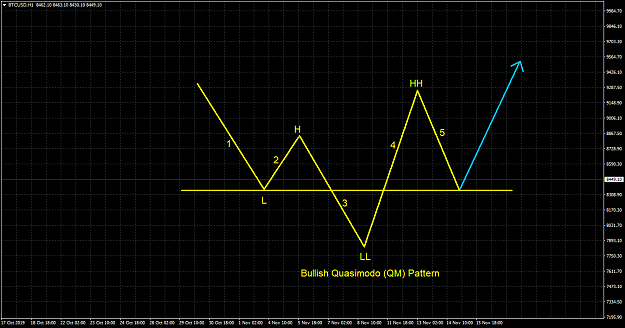
There are lots of material available on the subject of QM patterns but I will just try to describe the pattern in this post:

As seen in the first two pictures, it requires five legs to complete and entry is made at the end of the fifth leg. Better to use limit orders to not miss out the completion of the fifth leg. The legs are numbered in the second picture showing the bullish QM formation.
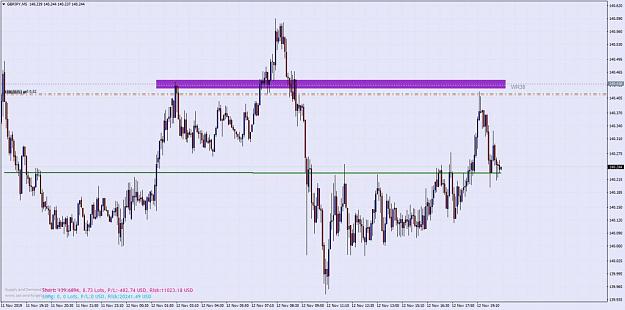
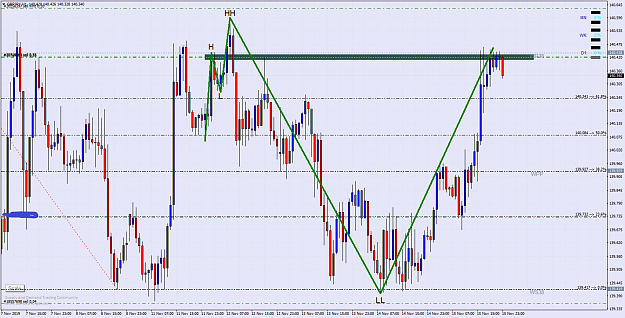
The third picture is an example I took on GBPJPY this week. This trade was with little to no drawdown. It doesn't always work as you know that in forex there are no certainties, but this gives a high degree of success and very good risk-reward.
Attached Image(s) (click to enlarge)
Click to Enlarge

Name: Bearish QM.png
Size: 39 KB
Click to Enlarge

Name: Bullish QM.png
Size: 40 KB
Click to Enlarge

Name: photo_2019-11-12_19-26-45.jpg
Size: 83 KB
 
 
  • Post #14
  • Quote
  • Nov 16, 2019 10:22am Nov 16, 2019 10:22am
  •  dan.n
  • | Joined Nov 2019 | Status: Member | 4 Posts
Hi Pipssometer,

This is my first post here. I just wanted to thank you for sharing this wonderful strategy.

I've been in forex market for nearly 1.5year and still struggling to find a system which fits me well. I only have little time to watch charts therefore I felt very stressful that I always have to worry about looking at charts and making sure I don't miss trade opportunities whenever I'm free.

Your strategy is awesome as you just analyze your chart beforehand then place your pending order and forget about it. I am very happy that you are here and trying to master your system.

I understood how QM level works. Would you mind talking more about risk-reward (TP and SL)? I assume we put our SL on last HH for short, and SL on last LL for long.

Thanks in advance!
 
 
  • Post #15
  • Quote
  • Nov 16, 2019 10:26am Nov 16, 2019 10:26am
  •  Pipsometer
  • | Joined Mar 2019 | Status: Member | 63 Posts
This is another trade I took on GBPJPY. Trade is still running. Notice how price reacted to that level.
Attached Image (click to enlarge)
Click to Enlarge

Name: GBPJPYH1SUB.png
Size: 63 KB
 
1
  • Post #16
  • Quote
  • Nov 16, 2019 10:53am Nov 16, 2019 10:53am
  •  Pipsometer
  • | Joined Mar 2019 | Status: Member | 63 Posts
EURAUD Sell limit at 1.6338.

I missed the lower QM level. Should have placed sell limit at the green rectangle.
Attached Image (click to enlarge)
Click to Enlarge

Name: EURAUDH4.png
Size: 60 KB
 
 
  • Post #17
  • Quote
  • Nov 16, 2019 11:16am Nov 16, 2019 11:16am
  •  Pipsometer
  • | Joined Mar 2019 | Status: Member | 63 Posts
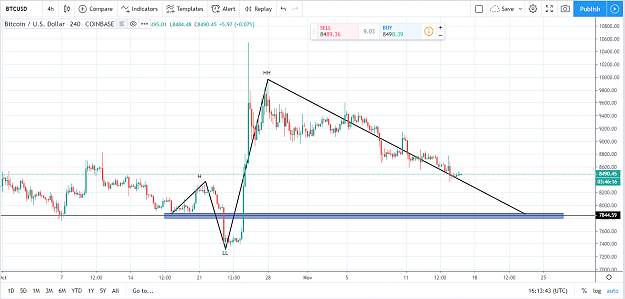
Bitcoin 4H.

This is a good buy should it get to the 7844 area. Still a long way down though.
Attached Image (click to enlarge)
Click to Enlarge

Name: BTCUSD 4H.PNG
Size: 85 KB
 
 
  • Post #18
  • Quote
  • Nov 16, 2019 4:08pm Nov 16, 2019 4:08pm
  •  Pipsometer
  • | Joined Mar 2019 | Status: Member | 63 Posts
Quoting dan.n
Disliked
Hi Pipssometer, This is my first post here. I just wanted to thank you for sharing this wonderful strategy. I've been in forex market for nearly 1.5year and still struggling to find a system which fits me well. I only have little time to watch charts therefore I felt very stressful that I always have to worry about looking at charts and making sure I don't miss trade opportunities whenever I'm free. Your strategy is awesome as you just analyze your chart beforehand then place your pending order and forget about it. I am very happy that you are here...
Ignored
Thank you for your kind words.

I think that beyond having a strategy it is important to be learn how to read the market well and to understand what story the price action is saying. I find that the concepts of engulfing patterns, quasimodo, supply and demand are invaluable if one is to be able to read the market well. I have tried several systems but none of them have helped me in understanding market movements like these concepts have. The issues of placing stops (SL and TP) are more trade-management related issue and I generally prefer to talk of trade execution rather than trade management because there are no general rules for SL and TP. It should depend on one's reading of the market at that point in time.

If for example there is a supply zone near the HH and above the QM level in a bearish QM set-up, I may enter at the QM level and place my stop above the HH. That reduces my risk-reward but it is a more realistic place to place the SL. Otherwise, I just place it 2-5 pips above the QM level to take care of spread. This yields an much better risk-reward and is also a realistic place. TP profit would also depend on the price action to the left. Remember that the market leaves behind clues of potential reversal points and it is just a matter of determining which zones are weak and which are strong. If there are no strong supply and demand zones to the left, I can place my TP as far as possible.

I will try later to see if I can get some charts to explain this narration.
 
 
  • Post #19
  • Quote
  • Nov 16, 2019 4:11pm Nov 16, 2019 4:11pm
  •  Pipsometer
  • | Joined Mar 2019 | Status: Member | 63 Posts
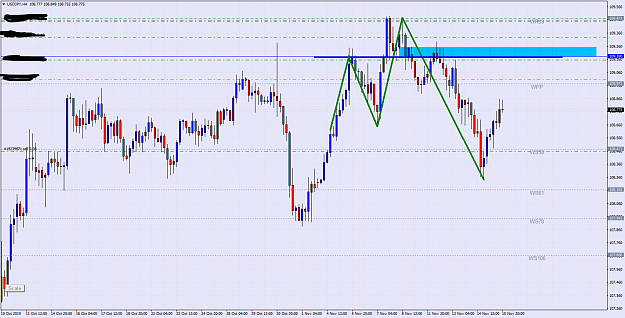
USDJPY 4-HR

Sell limit at 109.17.
Attached Image (click to enlarge)
Click to Enlarge

Name: USDJPYH4.png
Size: 53 KB
 
 
  • Post #20
  • Quote
  • Nov 16, 2019 4:25pm Nov 16, 2019 4:25pm
  •  Pipsometer
  • | Joined Mar 2019 | Status: Member | 63 Posts
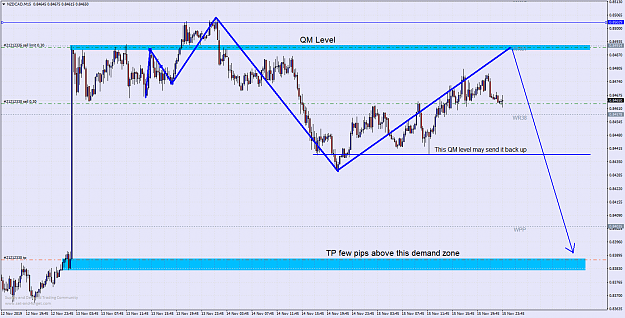
NZDCAD 15 Min

Sell Limit at 0.84914. SL should be safe at 0.84950 (+a few pips for spread and broker differences)
TP at 0.83890. Watch out for area around 0.84415 as there is a QM level there that may send prices back up.
Attached Image (click to enlarge)
Click to Enlarge

Name: NZDCADM15.png
Size: 87 KB
 
 
  • Trading Journals
  • /
  • QM/SnD Price Action "System"
  • Reply to Thread
    • Page 1 2
    • Page 1 2
0 traders viewing now
  • More
Top of Page
  • Facebook
  • Twitter
About FF
  • Mission
  • Products
  • User Guide
  • Media Kit
  • Blog
  • Contact
FF Products
  • Forums
  • Trades
  • Calendar
  • News
  • Market
  • Brokers
  • Trade Explorer
FF Website
  • Homepage
  • Search
  • Members
  • Report a Bug
Follow FF
  • Facebook
  • Twitter

FF Sister Sites:

  • Metals Mine
  • Energy EXCH
  • Crypto Craft

Forex Factory® is a brand of Fair Economy, Inc.

Terms of Service / ©2023