It seems crazy I know and maybe I'm happy it turns people away. I'd like to start a discord group or private group for this. Let's partner up!
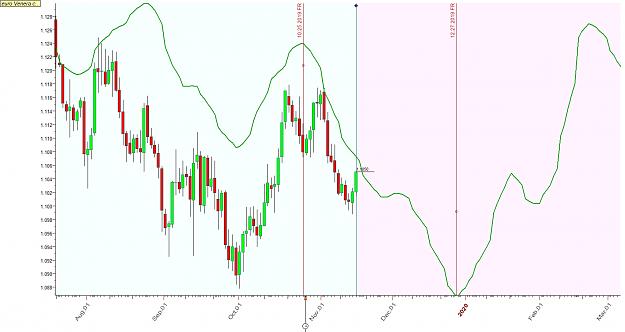
DislikedIt is a shame the lack of appreciation towards astrology in these forums. Because with a little knowledge it is very easy to earn money every week. When I have time I will upload accounts of everything I have gained in recent months that I have been uploading DJIA signals. I don't know how many people follow astrological predictions. If there were enough I would open a blog to upload the trading signals. DJIA, 13/nov/2011 {image} .Ignored