• Home
  • Forums
  • Trades
  • News
  • Calendar
  • Market
  • Brokers
  • Login
  • Join
  • User/Email: Password:
  • 9:50pm
Menu
  • Forums
  • Trades
  • News
  • Calendar
  • Market
  • Brokers
  • Login
  • Join
  • 9:50pm
Sister Sites
  • Metals Mine
  • Energy EXCH
  • Crypto Craft

Options

Bookmark Thread

First Page First Unread Last Page Last Post

Printable Version

Similar Threads

Seeking net long/short positions data for commercial traders 4 replies

Plot extern data on chart 1 reply

Plot DLL output in main chart and separate window MT4 0 replies

I want to plot my custom indicator from a 5min chart onto a 1min chart 2 replies

how to plot order close price on chart using ea 1 reply

  • Platform Tech
  • /
  • Reply to Thread
  • Subscribe
  • 29
Attachments: Plot long/short retail positions (from myfxbook) on MT4 chart
Exit Attachments

Plot long/short retail positions (from myfxbook) on MT4 chart

  • Last Post
  •  
  • 1 2Page 3 4
  • 1 2Page 3 4
  •  
  • Post #41
  • Quote
  • Nov 4, 2019 8:36am Nov 4, 2019 8:36am
  •  djordje
  • | Joined Mar 2019 | Status: Junior Member | 5 Posts
Quoting hanover
Disliked
From this post: "RSI taken from Monthly, Weekly, daily and H4 as posted here. Two RSI readings RSI2 + RSI 9 and divided by eight for a master rating." Composite RSI indicator is attached, which performs the above calculation, and plots the result as a timeseries. The calculation gives an identical result (for the current price) to fxbarwise's indicator here, hence I assume it's correct....
Ignored
Hi hanover,
First of all thank you for your effort and hard work.
Currently I am experimenting with the Composite RSI indicator. For example, if I put h1, h4, d1, w1 TF in Composite RSI and I trade on h1 chart, I have noticed that it repaint values last 2-3 candles, if I take a look at Data Window on MT4. I think it will be the same if I put h4, d1, w1, mn1 TF in Composite RSI and trade on h4 chart, last 2-3 candles will repaint also in some situations. Is it possible for the last closed candle to be locked in its value without changing? Sorry for grammar.Thanks
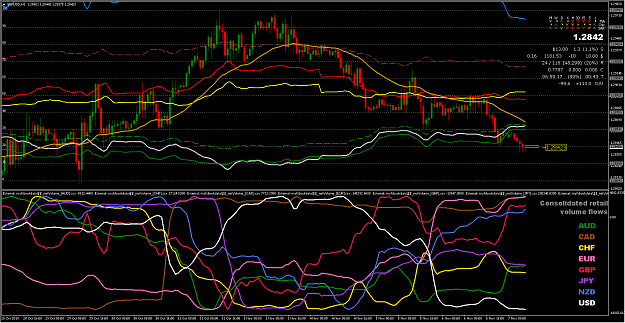
  • Post #42
  • Quote
  • Nov 4, 2019 3:48pm Nov 4, 2019 3:48pm
  •  hanover
  • Joined Sep 2006 | Status: ... | 8,081 Posts
Quoting djordje
Disliked
Currently I am experimenting with the Composite RSI indicator. For example, if I put h1, h4, d1, w1 TF in Composite RSI and I trade on h1 chart, I have noticed that it repaint values last 2-3 candles, if I take a look at Data Window on MT4. ....... Is it possible for the last closed candle to be locked in its value without changing?
Ignored
It repaints because it necessarily applies the higher TF RSI values retrospectively.

Anyway, I don't want to spend a lot of time on this, but try the attached. Install only the EX4 file unless you want to change the code yourself.

The MQ4 file is attached in case another programmer wants to modify the indicator (it will likely compile with a zillion errors, unless you do this first).

Don't know if I've stopped the repainting, but I ran the new version in Strategy Tester (RSI_TFs = "M1,M5,M15,M30" on M1 TF) and didn't see any obvious repainting, apart from the currently forming candle. Previous candle values should now be locked.
Attached Files
File Type: ex4 Composite RSI.ex4   19 KB | 249 downloads
File Type: mq4 Composite RSI.mq4   3 KB | 249 downloads
  • Post #43
  • Quote
  • Nov 4, 2019 4:44pm Nov 4, 2019 4:44pm
  •  djordje
  • | Joined Mar 2019 | Status: Junior Member | 5 Posts
Quoting hanover
Disliked
{quote} It repaints because it necessarily applies the higher TF RSI values retrospectively. Anyway, I don't want to spend a lot of time on this, but try the attached. Install only the EX4 file unless you want to change the code yourself. The MQ4 file is attached in case another programmer wants to modify the indicator (it will likely compile with a zillion errors, unless you do this first). Don't know if I've stopped the repainting, but I ran the new version in Strategy...
Ignored
You are really great coder, thank you very much hanover. I really appreciate your effort! I can see difference now. It is not repainting anymore
  • Post #44
  • Quote
  • Nov 6, 2019 4:20pm Nov 6, 2019 4:20pm
  •  titolupo
  • | Joined Nov 2019 | Status: Member | 9 Posts
Quoting hanover
Disliked
{quote} It repaints because it necessarily applies the higher TF RSI values retrospectively. Anyway, I don't want to spend a lot of time on this, but try the attached. Install only the EX4 file unless you want to change the code yourself. The MQ4 file is attached in case another programmer wants to modify the indicator (it will likely compile with a zillion errors, unless you do this first). Don't know if I've stopped the repainting, but I ran the new version in Strategy...
Ignored
Dear Hanover Knight of Charts , I seriously put all my efforts readiing all manual in order to get all the plot chart ex4 working on my platform , but it seems that I started with some trouble already at the time spin the exe app on WINDOWS10. It in fact classifies The Download-myfxbook.exe file as a dangerous trojan, although I disabled its overcontrol, I am not sure the app is gathering data correctly as I do not see an increase in files size . I anyway hear the sound of the data update with the exact refresh interval , but No graph is plotted. I can see moreofer the app icon FX on the systray only when the INI configuration dwindow is open otherwise the app looks "off" although I hear the beep of refresh..... I 'm getting crazy
  • Post #45
  • Quote
  • Edited Nov 7, 2019 4:15pm Nov 6, 2019 11:54pm | Edited Nov 7, 2019 4:15pm
  •  hanover
  • Joined Sep 2006 | Status: ... | 8,081 Posts
Quoting titolupo
Disliked
It in fact classifies The Download-myfxbook.exe file as a dangerous trojan
Ignored
I've been running this software for several months now without any problems. It's still working ok on my (Windows 7 64 bit) computer as the recently taken screenshot below demonstrates.

However, I take any malware reports seriously, and hence I've deleted the zip file from post #1. It could easily be a false positive but I don't want to expose FF members to any possible risk. Many thanks for alerting me to this.
Attached Image (click to enlarge)
Click to Enlarge

Name: PPI 252.png
Size: 68 KB


Quoting titolupo
Disliked
I am wondering if I unzipped Your folder in the right place inside my metatrader provider folder. As consequence I was also wondering if indicators on platform are then correctly mirroring to the right place to find csv files , otherwise they seek for a ghost.
Ignored
The folder tree in the ZIP is exactly the same as that in your installed MT4 (which you obtain using MT4 menu option "File -> Open Data Folder ->"), making it easy enough to check whether the files are in the same folders as they appear in the ZIP.

If you've read everything in the 'Troubleshooting' section in the PDF, and also all of my replies in post #1, then sorry but I've run out of ideas. Apparently your computer setup is different to mine, but I have no way of knowing which difference(s) might be causing your problem, or why. Perhaps your anti-malware app is disabling or quarantining some of the files needed for the software to run properly?

As I pointed out, my research suggests that SSI is at best a confirming indicator — its plot is almost always an exact mirror image of the price movement — hence I wouldn't be too disappointed if you can't the software to run correctly.
  • Post #46
  • Quote
  • Nov 7, 2019 4:35am Nov 7, 2019 4:35am
  •  titolupo
  • | Joined Nov 2019 | Status: Member | 9 Posts
Quoting hanover
Disliked
{quote} I've been running this software for several months now without any problems. It's still working ok on my (Windows 7 64 bit) computer as the recently taken screenshot below demonstrates. However, I take any malware reports seriously, and hence I've deleted the zip file from post #1. It could easily be a false positive but I don't want to expose FF members to any possible risk. Many thanks for alerting me to this. {image}
Ignored
Dear Hanover, I'm not aware of these "MALWARE" things but I might suppose the latest Win10 defender recognizes the open door to MYfxboox website as a suspicious act, as it constantly refresh datas on Download myfxbook data. As I consider Your job one of the best pieces on the forex, I don't give up concerning my issues in making the indicator run smoothly on a newer win OS ( temporarily granting access). I would expose to Your attention that now I got the app to download datas from MyFxbook and refresh csv file in its dedicated folder, but although I installed all indicators and Templates into the according platform folders as usual, I find the "Hanover"templates working only partially, I.e. it reports currency strenght and many other info but DOESN'T plot any outlook graph either on main window nor in a separate.Although I firmly followed your instructions, I am wondering if I unzipped Your folder in the right place inside my metatrader provider folder. As consequence I was also wondering if indicators on platform are then correctly mirroring to the right place to find csv files , otherwise they seek for a ghost. I would be pleased if you would take in consideration my doubts. Regards
  • Post #47
  • Quote
  • Nov 8, 2019 9:30am Nov 8, 2019 9:30am
  •  djordje
  • | Joined Mar 2019 | Status: Junior Member | 5 Posts
Quoting hanover
Disliked
{quote} It repaints because it necessarily applies the higher TF RSI values retrospectively. Anyway, I don't want to spend a lot of time on this, but try the attached. Install only the EX4 file unless you want to change the code yourself. The MQ4 file is attached in case another programmer wants to modify the indicator (it will likely compile with a zillion errors, unless you do this first). Don't know if I've stopped the repainting, but I ran the new version in Strategy...
Ignored
Unfortunately, Composite RSI still repaint Even 8-9 candles backward and cancels previously received signals at 70/30 levels,especially if we have some big changes in current price-candle. I have noticed that right now after CAD Employment Change report release.
Like you said It repaints because it necessarily applies the higher TF RSI values retrospectively.. That must be it, but thanks anyway hanover!
  • Post #48
  • Quote
  • Edited at 7:59am Nov 15, 2019 7:40am | Edited at 7:59am
  •  Mcken
  • | Joined Sep 2014 | Status: Member | 8 Posts
I can't find appropriate words to express my gratitude to Hanover for the great tool that he has freely shared with us. I have been using it and it is awesome beyond measure.

I wish to have the MyfxbookOutlook data (%Short, Net Vol, Net Pos, Total Vol, date/time) saved in a separate csv file after a specified interval, that I can access from Ms Excel for further processing. The separate csv file should keep all past data so that I am able to track changes and represent the data in graphs and charts.
I am requesting any programmer within the thread who can develop a tool to accomplish the above to reach out to me via PM and let me know what it would cost me. I also welcome advice on where else I can get a programmer to develop the solution/tool.

Profitable trading,
Tim
  • Post #49
  • Quote
  • Nov 15, 2019 9:33am Nov 15, 2019 9:33am
  •  guido9
  • | Joined Oct 2016 | Status: Member | 21 Posts
it's such a shame about the odd over-zealous trojan flag! - please see posts on same subject with the Plot NEWS indicator. These are both wonderful pieces of work, thank you so much Hanover . No doubt a false positive, so hope the Plot myfxbook indi will become available again.

"dont worry about the message. It’s a false positive on that file. Because it emulates keystrokes, windows deems it a Trojan. It was made with a program called AutoHotKey. No big deal. I have made my own version and it gave my one a false positive."
https://www.forexfactory.com/showthr...1#post11798171


and post #282 etc verifying all ok...
https://www.forexfactory.com/showthr...549773&page=15
  • Post #50
  • Quote
  • Nov 16, 2019 5:45pm Nov 16, 2019 5:45pm
  •  FxChampion9
  • | Joined Sep 2018 | Status: Member | 46 Posts
Quoting hanover
Disliked
From this post: "RSI taken from Monthly, Weekly, daily and H4 as posted here. Two RSI readings RSI2 + RSI 9 and divided by eight for a master rating." Composite RSI indicator is
Ignored
This indicator is like real sorcery! Doing some test together with another indie....looks like a match in heaven =)
Peace be upon you all!
And thank you!!!
  • Post #51
  • Quote
  • Nov 24, 2019 1:35pm Nov 24, 2019 1:35pm
  •  titolupo
  • | Joined Nov 2019 | Status: Member | 9 Posts
Quoting guido9
Disliked
it's such a shame about the odd over-zealous trojan flag! - please see posts on same subject with the Plot NEWS indicator. These are both wonderful pieces of work, thank you so much Hanover . No doubt a false positive, so hope the Plot myfxbook indi will become available again. "dont worry about the message. It’s a false positive on that file. Because it emulates keystrokes, windows deems it a Trojan. It was made with a program called AutoHotKey. No big deal. I have made my own version and it gave my one a false positive." https://www.forexfactory.com/showthr...1#post11798171...
Ignored
This is my opinion as well, But Hanover is so good that in the doubt froze the link.
  • Post #52
  • Quote
  • Nov 24, 2019 1:44pm Nov 24, 2019 1:44pm
  •  titolupo
  • | Joined Nov 2019 | Status: Member | 9 Posts
Quoting hanover
Disliked
{quote} I've been running this software for several months now without any problems. It's still working ok on my (Windows 7 64 bit) computer as the recently taken screenshot below demonstrates. However, I take any malware reports seriously, and hence I've deleted the zip file from post #1. It could easily be a false positive but I don't want to expose FF members to any possible risk. Many thanks for alerting me to this.{image} {quote} The folder tree in the ZIP is exactly the same as that in your installed MT4 (which you obtain using MT4 menu option...
Ignored

Dear Hanover , I would be very pleased if one day Your magic indicator could plot also graphs of the hystorical average prices charge short/long, these average ask/bid prices are actually available in real time on my fxbook website , but as soon as we grab all them with you fantastic download exe, the hypothesis of having an hystorical visualization of the retailer bid ask average entrance over price action could be very helpful to estimate imminent inversions both on excesses and crosses of the retailers postitions.
Hope you can find time to reply, kindest regards Mattia
  • Post #53
  • Quote
  • Dec 16, 2019 8:40am Dec 16, 2019 8:40am
  •  PeterE
  • Joined Oct 2009 | Status: magic | 1,729 Posts
Doubting that trade?
Look here, if you are trading in the opposite direction, the probabilities are on your side.
  • Post #54
  • Quote
  • Jan 8, 2020 11:32pm Jan 8, 2020 11:32pm
  •  fxlearner981
  • | Joined May 2018 | Status: Junior Member | 5 Posts
Hi,

Can someone please find me the code related to this thread, as the zip files are already removed from post 1.
  • Post #55
  • Quote
  • Jan 10, 2020 7:40am Jan 10, 2020 7:40am
  •  Nguyenanhtu
  • | Joined May 2017 | Status: I'm Santiago | 13 Posts | Online Now
Ok
Attached File
File Type: zip Plot retail data from myfxbook outlook 1.zip   8.7 MB | 212 downloads
  • Post #56
  • Quote
  • Jan 17, 2020 9:25pm Jan 17, 2020 9:25pm
  •  hanover
  • Joined Sep 2006 | Status: ... | 8,081 Posts
Quoting djordje
Disliked
Unfortunately, Composite RSI still repaint. Even 8-9 candles backward and cancels previously received signals at 70/30 levels, especially if we have some big changes in current price-candle. I have noticed that right now after CAD Employment Change report release. Like you said It repaints because it necessarily applies the higher TF RSI values retrospectively..
Ignored
Don't know if this is still relevant to you, but a similar repainting issue (albeit with different indicators) was reported in this thread. I believe it's happening for much the same reason. It occurs because a MTF indicator that's being refreshed on a shorter TF is including data from a longer TF in its calculation. Pakeha explains it more clearly than I did previously:

"Technically, they don’t repaint. However, when you do multi-time frame analysis the indicators will ‘recalculate’. In this case the Frama ribbon and the SuperTrend candles are weekly indicators, and Chris is trading on the daily timeframe. So the indicators are ‘calculating’ each day, but their values only become final at the end of each week. So for example, a dot may appear on the Frama ribbon any day during the week and not be there at the end of the week. Nothing wrong with it, because that is how the indicators work in MTF analysis. However, doing a visual back test on MTF analysis always looks better than what it really is when trading forward on a day by day basis."
  • Post #57
  • Quote
  • Jan 19, 2020 11:17am Jan 19, 2020 11:17am
  •  djordje
  • | Joined Mar 2019 | Status: Junior Member | 5 Posts
Quoting hanover
Disliked
{quote} Don't know if this is still relevant to you, but a similar repainting issue (albeit with different indicators) was reported in this thread. I believe it's happening for much the same reason. It occurs because a MTF indicator that's being refreshed on a shorter TF is including data from a longer TF in its calculation. Pakeha explains it more clearly than I did previously: "Technically, they don’t repaint. However, when you do multi-time frame analysis the indicators...
Ignored
Thank you for explanation
  • Post #58
  • Quote
  • Oct 9, 2020 3:47am Oct 9, 2020 3:47am
  •  jinxee
  • | Joined Sep 2020 | Status: Member | 4 Posts
Hanover did an amazing job with the indicator and we all feel blessed to use his creation, I had a question in mind that if im supposed to keep my system running for the software to fetch data from myfxbook.com or I can shut it down nd get on wit my day?, Thanks you. (my interval is 15 mins)
  • Post #59
  • Quote
  • Oct 9, 2020 4:15pm Oct 9, 2020 4:15pm
  •  hanover
  • Joined Sep 2006 | Status: ... | 8,081 Posts
Quoting jinxee
Disliked
Hanover did an amazing job with the indicator and we all feel blessed to use his creation, I had a question in mind that if im supposed to keep my system running for the software to fetch data from myfxbook.com or I can shut it down nd get on wit my day?, Thanks you. (my interval is 15 mins)
Ignored
You can shut MT4 down but the Download_myfxbook_outlook.exe app must be running continuously for all the time that you want it to gather data. It can be set up to run in the background, and started/stopped using an icon in the systray -- read pages 5 onward in the Instruction pdf for more info. If you stop or pause the app, data will not be collected and there will be gaps in any continuous timeseries graphs that you are plotting in MT4 using the Plot External Data.ex4 indicator.

On the other hand, if you aren't interested in plotting these graphs, i.e. you are using only the dashboard (see the pic on p4 of the pdf) and collecting data by running Download_myfxbook_outlook.exe manually whenever you want to refresh the dashboard, then obviously you don't need to have it running continuously. So you could shut down your whole computer any time you wished.

The reason for all of this is that myfxbook outlook only keeps the current data, so the Download_myfxbook_outlook.exe app can't get historical data from that webpage after it gets overwritten with the latest data. The app takes a snapshot of that data and builds its own history (if running in continuous mode).

Fwiw I found that the plotted graphs were little more than a mirror image of price (for the vast majority of the time). Hence they were a confirming rather than a leading indicator. So I didn't find the software all that useful. But I needed to do the research to reach that conclusion and find out for myself.

Take care and stay safe.
1
  • Post #60
  • Quote
  • Oct 11, 2020 8:54am Oct 11, 2020 8:54am
  •  jinxee
  • | Joined Sep 2020 | Status: Member | 4 Posts
Quoting hanover
Disliked
{quote} You can shut MT4 down but the Download_myfxbook_outlook.exe app must be running continuously for all the time that you want it to gather data. It can be set up to run in the background, and started/stopped using an icon in the systray -- read pages 5 onward in the Instruction pdf for more info. If you stop or pause the app, data will not be collected and there will be gaps in any continuous timeseries graphs that you are plotting in MT4 using the Plot External Data.ex4 indicator. On the other hand, if you aren't interested in plotting these...
Ignored
great bud, i was also wondering what does terms like netCount, longPriceCell, ShortPriceCell; shortDisCell, LongDisCell mean, I figured out longPct, shortPct aha, its been just 1 day using the sentiment analysis and i can already see this getting implemented with my trading style, great work again!!!!
  • Platform Tech
  • /
  • Plot long/short retail positions (from myfxbook) on MT4 chart
  • Reply to Thread
    • 1 2Page 3 4
    • 1 2Page 3 4
0 traders viewing now
  • More
Top of Page
  • Facebook
  • Twitter
About FF
  • Mission
  • Products
  • User Guide
  • Media Kit
  • Blog
  • Contact
FF Products
  • Forums
  • Trades
  • Calendar
  • News
  • Market
  • Brokers
  • Trade Explorer
FF Website
  • Homepage
  • Search
  • Members
  • Report a Bug
Follow FF
  • Facebook
  • Twitter

FF Sister Sites:

  • Metals Mine
  • Energy EXCH
  • Crypto Craft

Forex Factory® is a brand of Fair Economy, Inc.

Terms of Service / ©2021