• Home
  • Forums
  • Trades
  • News
  • Calendar
  • Market
  • Brokers
  • Login
  • Join
  • User/Email: Password:
  • 8:33pm
Menu
  • Forums
  • Trades
  • News
  • Calendar
  • Market
  • Brokers
  • Login
  • Join
  • 8:33pm
Sister Sites
  • Metals Mine
  • Energy EXCH
  • Crypto Craft

Options

Bookmark Thread

First Page First Unread Last Page Last Post

Printable Version

Similar Threads

Planetary cycles, astrological theory of cycles of the markets 492 replies

Planetary / Astrology indicators 3 replies

Forecast Forex using Numeric Cycles and Astrology Cycles 32 replies

Planetary Cycles... Plotting Cycles into the Future 0 replies

Opinions on "Planetary cycles, astrological theory .. of the markets" 40 replies

  • Interactive Trading
  • /
  • Reply to Thread
  • Subscribe

Planetary Cycles Trading (EUR/USD)

  • Last Post
  •  
  • 1 537538Page 539540541 605
  • 1 Page 539 605
  •  
  • Post #10,761
  • Quote
  • Oct 25, 2019 10:46am Oct 25, 2019 10:46am
  •  santoso_am
  • | Joined Sep 2010 | Status: Member | 76 Posts
Quoting Student1440
Disliked
Thanks for the reply . The only Planet that stopped the 10% fall on the 13th August 2004 was Helio Mars . The low on this date was 1060.72 which converts to 9 Deg 43"Pisces opposite or 180 Deg Helio Mars at 8 Deg 54" Virgo . If we examine a Geocentric ephemeris for this date we can see that the price did not form any aspects to the Geocentric Planets on this date . At the Low Date the Sun was in its ruling sign Leo trine Pluto which is a benefic aspect but it had no geometric connection to the Low price . The day of the Low was Friday which is ruled...
Ignored
all astro event : (aspect ingress etc) work sometime, not always. thats why we have to filter & combine with other event + TA

btw good info with planet numerology
  • Post #10,762
  • Quote
  • Oct 25, 2019 10:22pm Oct 25, 2019 10:22pm
  •  jnevins
  • Joined Feb 2007 | Status: Member | 2,098 Posts
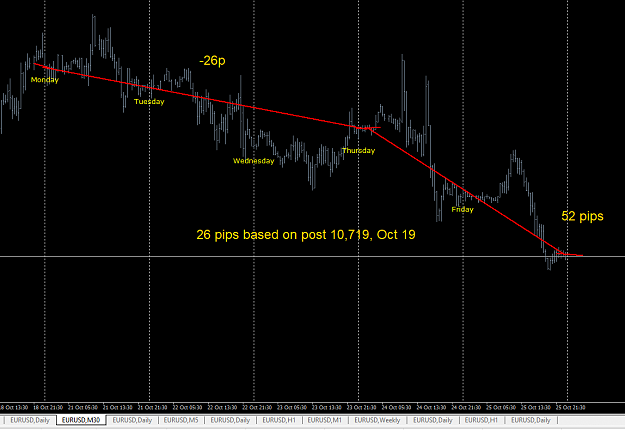
End of week recap... 26 pips based on post 10,719, Oct 19.
Attached Image (click to enlarge)
Click to Enlarge

Name: Capture.PNG
Size: 34 KB
  • Post #10,763
  • Quote
  • Oct 25, 2019 11:29pm Oct 25, 2019 11:29pm
  •  jnevins
  • Joined Feb 2007 | Status: Member | 2,098 Posts
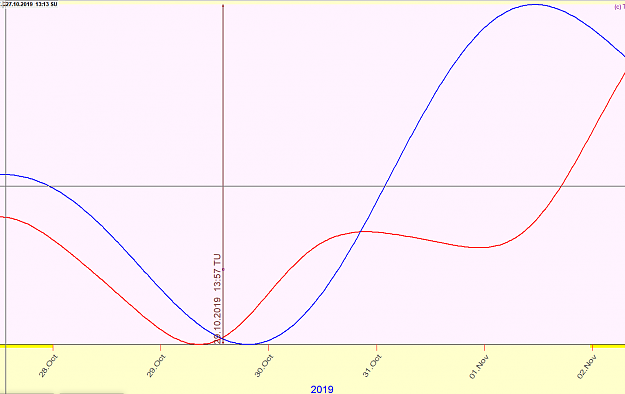
EUR/USD outlook for next week... 30 min bars, UTC+2.
Red line is Spectrum inverted line, blue line is Q Spectrum 1 major peak at 14.2 days. 10,000 bars of history.
Attached Image (click to enlarge)
Click to Enlarge

Name: Capture.PNG
Size: 27 KB
1
1
  • Post #10,764
  • Quote
  • Oct 26, 2019 4:57am Oct 26, 2019 4:57am
  •  Suryananda
  • Joined Nov 2010 | Status: Member | 623 Posts
Quoting Suryananda
Disliked
Prediction for next week. 21-oct-2019 to 25-oct-2019 DJIA {image} .
Ignored
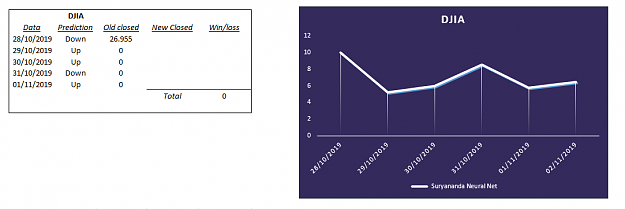
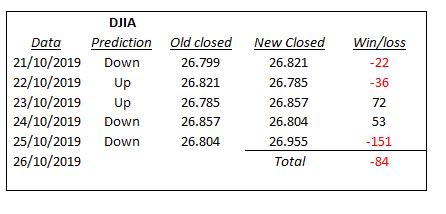
DJIA, results of this week.

Attached Image

.
1
  • Post #10,765
  • Quote
  • Oct 26, 2019 5:08am Oct 26, 2019 5:08am
  •  Suryananda
  • Joined Nov 2010 | Status: Member | 623 Posts
Important:
We only take astrological predictions with a Average Average 30 sessions.
If the prediction is bullish and the price is above MA30, then Buy.
If the prediction is bearish and the price is below MA30, then Sell.
Without the preconditions, then we do nothing.
Next week's count I will do it this way.


DJIA, next week. Oct 28, 2019 to Nov 1, 2019
Attached Image (click to enlarge)
Click to Enlarge

Name: 2019-10-26 09_09_09-Window.png
Size: 22 KB

.
1
  • Post #10,766
  • Quote
  • Oct 26, 2019 6:53am Oct 26, 2019 6:53am
  •  Student1440
  • | Joined Sep 2019 | Status: Member | 32 Posts
30th October should high for SP500 . Will try and calculate a price level or levels when time permits
  • Post #10,767
  • Quote
  • Oct 26, 2019 10:49am Oct 26, 2019 10:49am
  •  jnevins
  • Joined Feb 2007 | Status: Member | 2,098 Posts
Quoting Suryananda
Disliked
{quote} DJIA, results of this week. {image} .
Ignored
This was a difficult week for predictions... One theory I have is as the Sun enters a new house, predictions become more difficult. I have not backtested that theory enough to rely on it however. Thanks for posting the end of the week outcome.
1
  • Post #10,768
  • Quote
  • Oct 26, 2019 12:59pm Oct 26, 2019 12:59pm
  •  priyanka285
  • | Joined Oct 2019 | Status: Member | 8 Posts
Quoting njana
Disliked
{quote} I have a theory based on the below list, currency of the country is tied to the mundane astro prediction, so, we can trade as per the reaction of the countries astro natal ( based on independence day & capital of the country ), it must all align!! {image}
Ignored
I am reading the TG Butaney and find it really useful. I had some astrological knowledge so am able to understand the book.

Mostly the book is about the overall view of astrology on prices. There is no intraday concept in that though.
  • Post #10,769
  • Quote
  • Oct 26, 2019 1:02pm Oct 26, 2019 1:02pm
  •  priyanka285
  • | Joined Oct 2019 | Status: Member | 8 Posts
Quoting jnevins
Disliked
{quote} Thank you Njana... I completely agree.. Henry Steele has the best tutorials on setting up and using Astrolog.
Ignored
The videos of Henry Steele are easy to understand. Henry Steele videos were easy to grasp.
  • Post #10,770
  • Quote
  • Oct 26, 2019 1:06pm Oct 26, 2019 1:06pm
  •  priyanka285
  • | Joined Oct 2019 | Status: Member | 8 Posts
Quoting Student1440
Disliked
30th October should high for SP500 . Will try and calculate a price level or levels when time permits
Ignored
Hi Suryananda, Please guide me if KP Nadi astrology can be used to predict the stock as you are doing. If it is so, i would like to learn it. I have been through thogh KP astrology from few weeks.
  • Post #10,771
  • Quote
  • Oct 26, 2019 1:06pm Oct 26, 2019 1:06pm
  •  priyanka285
  • | Joined Oct 2019 | Status: Member | 8 Posts
Quoting Student1440
Disliked
30th October should high for SP500 . Will try and calculate a price level or levels when time permits
Ignored
Hi Suryananda, Please guide me if KP Nadi astrology can be used to predict the stock as you are doing. If it is so, i would like to learn it. I have been through thogh KP astrology from few weeks.
  • Post #10,772
  • Quote
  • Edited Oct 27, 2019 11:07am Oct 26, 2019 3:43pm | Edited Oct 27, 2019 11:07am
  •  Suryananda
  • Joined Nov 2010 | Status: Member | 623 Posts
Quoting priyanka285
Disliked
{quote} I am reading the TG Butaney and find it really useful. I had some astrological knowledge so am able to understand the book. Mostly the book is about the overall view of astrology on prices. There is no intraday concept in that though.
Ignored
Quoting priyanka285
Disliked
{quote} Hi Suryananda, Please guide me if KP Nadi astrology can be used to predict the stock as you are doing. If it is so, i would like to learn it. I have been through thogh KP astrology from few weeks.
Ignored

I do not know anything about astrology nadi.
You need an x64 bit computer and at least 8 GB RAM. If they are 16 GB much better. Use MS Office 2016. This consumes less resources.
You have to learn to program in VBA at the user level.
You also need to learn astronomy at the amateur level. This will allow you to build your own programs. Example:
Inserted Video

This is going to give you a lot of work. But if you work hard enough you can build your own astro trading system. Here is another example:
https://bradleysiderograph.com/advan...tro-indicator/
You use the Excel programs that amateur astronomers use. That gives exact times. Then export to a csv file and import it to MT4.
https://astroexcel.wordpress.com/about/download/

You can use Greco-Latin, Vedic or Nadi astrology. But you need to create your own analysis software. Without that you will not get anything.
Luck.

Postscript:
This is the best astro sheet that I know.
Attached File
File Type: xls astroexcel_v20170611 (1).xls   4.4 MB | 853 downloads

For MT4 and average prices.
Attached File
File Type: mqh CsvReader.mqh   19 KB | 128 downloads

Attached File
File Type: mq4 Seasonal.mq4   8 KB | 140 downloads
2
  • Post #10,773
  • Quote
  • Oct 26, 2019 5:55pm Oct 26, 2019 5:55pm
  •  Suryananda
  • Joined Nov 2010 | Status: Member | 623 Posts
Quoting jnevins
Disliked
{quote} This was a difficult week for predictions... One theory I have is as the Sun enters a new house, predictions become more difficult. I have not backtested that theory enough to rely on it however. Thanks for posting the end of the week outcome.
Ignored
Brexit is an exceptional fact that continually startles in European currencies.
.
  • Post #10,774
  • Quote
  • Oct 26, 2019 11:16pm Oct 26, 2019 11:16pm
  •  Student1440
  • | Joined Sep 2019 | Status: Member | 32 Posts
30th October SP500 3075 Top seems an important price but may have to refine on the date
  • Post #10,775
  • Quote
  • Oct 27, 2019 7:14am Oct 27, 2019 7:14am
  •  Suryananda
  • Joined Nov 2010 | Status: Member | 623 Posts
Quoting jnevins
Disliked
{quote} This was a difficult week for predictions... One theory I have is as the Sun enters a new house, predictions become more difficult. I have not backtested that theory enough to rely on it however. Thanks for posting the end of the week outcome.
Ignored
Jnevins, you read the explanations of the programmer. The astrological phenomenon is quite complex.

https://bradleysiderograph.com/finan...y-garth-allen/
.
1
  • Post #10,776
  • Quote
  • Oct 27, 2019 11:29am Oct 27, 2019 11:29am
  •  priyanka285
  • | Joined Oct 2019 | Status: Member | 8 Posts
Quoting Suryananda
Disliked
{quote} Brexit is an exceptional fact that continually startles in European currencies. .
Ignored
Suryananda, Appreaciate your detailed guide. I went through the video and it gives good dierction which i need to study further and practice.

Regarding KP astrology, Have been trying to practice one theory which predicts the index movement daily by points. e.g. it finds out like NiftyFifty +50 on monday, -50 on Tuesday etc. I have seen it is working atleast 4 times correct out of 5 predictions which made me to start reading this. I will update if it really works out.
  • Post #10,777
  • Quote
  • Oct 27, 2019 7:00pm Oct 27, 2019 7:00pm
  •  Suryananda
  • Joined Nov 2010 | Status: Member | 623 Posts
Prediction, you have to take it with the proper precautions.

EURUSD, 28/oct/2019. UTC time. Sign C=BUY; V=SELL.
1 day chart:
If MA14>MA60 and sign is C, then BUY.
If MA14<MA60 and sign is V, then SELL.

Attached Image


Indicator.
Attached File
File Type: mq4 pipsometer_5_decimal.mq4   11 KB | 95 downloads
  • Post #10,778
  • Quote
  • Oct 27, 2019 10:08pm Oct 27, 2019 10:08pm
  •  njana
  • | Joined Nov 2011 | Status: Member | 21 Posts
Quoting priyanka285
Disliked
I am reading the TG Butaney and find it really useful. I had some astrological knowledge so am able to understand the book. Mostly the book is about the overall view of astrology on prices. There is no intraday concept in that though.
Ignored
TGB/FCD books forms the core of AstroTrading principles, mundane astrology, combinations & aspects, etc. You may consider them as must have generic info to take AstroTrade. However, to do intraday trades, you need to be specific with time, this is when Nadi System of KP Astrology based time predictions comes to play.

And give special attention to elemental influences of Zodiac signs.
  • Post #10,779
  • Quote
  • Edited at 10:51pm Oct 27, 2019 10:17pm | Edited at 10:51pm
  •  jnevins
  • Joined Feb 2007 | Status: Member | 2,098 Posts
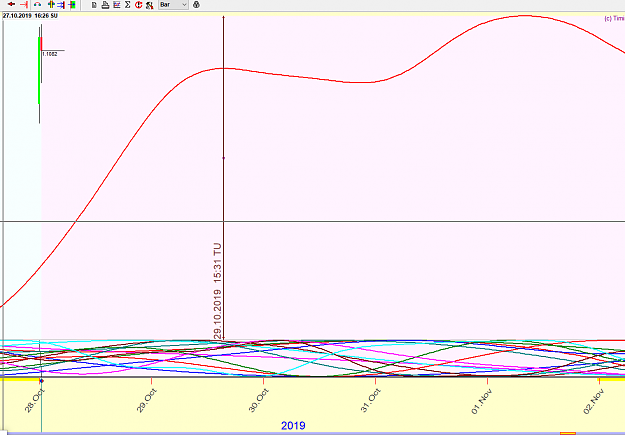
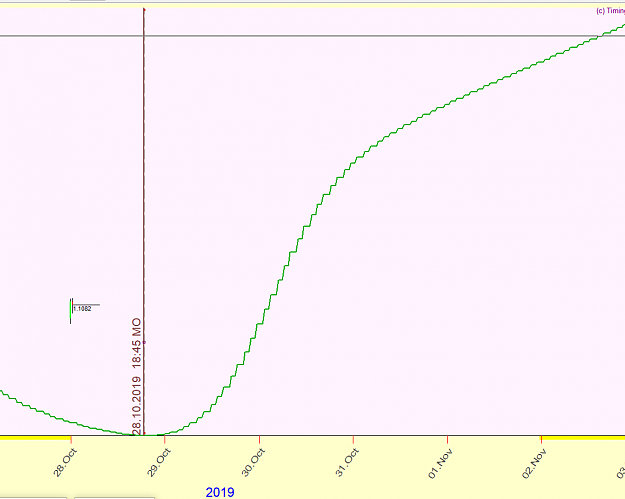
I would like to replace my earlier weekly prediction with this one... I don't see a reason for an inversion this week. This replaces post 10,763

The second image is a Jupiter Neptune curve, 36th harmonic, phase study and inverted to match the previous weeks PA.
Attached Images (click to enlarge)
Click to Enlarge

Name: Capture.PNG
Size: 36 KB Click to Enlarge

Name: Capture1.PNG
Size: 18 KB
1
  • Post #10,780
  • Quote
  • Oct 28, 2019 1:10am Oct 28, 2019 1:10am
  •  Student1440
  • | Joined Sep 2019 | Status: Member | 32 Posts
Thanks Pipin I know that Gann would compare the current position of the market and look back to his to his Master Charts to determine what cycle we are current running against and once the correct cycle was identified he could use this to gauge the amplitude and expected duration that the trend will follow. But in terms of extracting sections of past market cycles and matching them against current formations was what Gann referred to as Repeating Patterns but it isn't an exact science as there are variables in time duration between minor swing points and differences in price amplitude but it does provide a roadmap on trend direction . As a hypothetical example we might compare a 2 month correction in 2019 at a specific date against a 2 month correction in 2019 that occurred in the same month but on different dates with similar astronomical signatures both corrections occuring in bull markets with roughly the same price amplitude and time frequency so based on this would you extract this section of time which we have identified as a repeating cycle and create a composite model to be used as an overlay on the current repeating cycle . I have applied this method on several occasions where I have manually copied a curve chart and compared the two cycles which will provide general trend direction but the orientation of the minor tops within the sequence differ . As a hypothetical example the 2009 correction might run from 13th September top down 28th minor low then swing up to 5th October minor high then swing down 28th October Final Low so we have three minor swing points within the Primary structure . But compared against the 2019 Hypothetical correction we have a Top on the 2nd September which is in the same month but 11 days before the 2009 Top then we run down to the 19th September minor low back up to 29th September minor high then down to 22nd Final October low where we can see the context of the trend is similar but the amplitude of price swings and time duration between minor swing points differs considerably . Even if we took the data from the 2009 section and constructed a summational wave model at least it will give us the directional position of the general trend but won't give us precise orientation on whether the minor swing points are high or low . So in additional to this historical trend composite model would you also use the current trend over a specific time period as an input in your composite model gauge general trend direction . I had a brief look at the Bradley model which appears to based on a weighting system of aspects to prepare a market curve but I am leaning towards learning Baurmings work on summational wave mechanics which may present a more robust and accurate model of market prediction . Regards grant

line is the composite. {image}[/quote]
  • Interactive Trading
  • /
  • Planetary Cycles Trading (EUR/USD)
  • Reply to Thread
    • 1 537538Page 539540541 605
    • 1 Page 539 605
3 traders viewing now, 1 is a member:
Invisible
  • More
Top of Page
  • Facebook
  • Twitter
About FF
  • Mission
  • Products
  • User Guide
  • Media Kit
  • Blog
  • Contact
FF Products
  • Forums
  • Trades
  • Calendar
  • News
  • Market
  • Brokers
  • Trade Explorer
FF Website
  • Homepage
  • Search
  • Members
  • Report a Bug
Follow FF
  • Facebook
  • Twitter

FF Sister Sites:

  • Metals Mine
  • Energy EXCH
  • Crypto Craft

Forex Factory® is a brand of Fair Economy, Inc.

Terms of Service / ©2021