Would you please tell us what is the advantage of using RAOG, as normal RSI also indicates the momentum, direction & strength of the trend of any currency pair?
Would you please tell us what is the advantage of using RAOG, as normal RSI also indicates the momentum, direction & strength of the trend of any currency pair?
Ignored
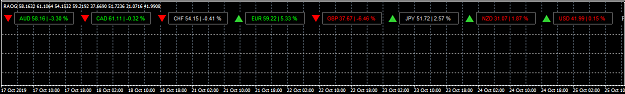
RAOG is all calculated of RSI with 28 pair , i give u some example :
USDCAD RSI Value is 62% USDJPY RSI Value is 35%
Thats mean USD Stronger VS CAD But Weakles VS JPY
and the calculated of RAOG for USD is 62+35/2 = 48.5%
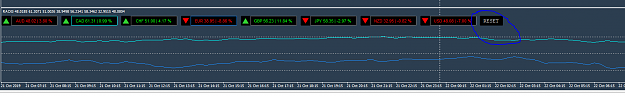
The indicator looks interesting. The issue I have with it is once I have selected a currency pair I cant de-select that pair. So when I select all the pairs the indicator has all the values of every pair is showing on the indicator, and I cant deselect the pairs unless I close mt4. Anyone else noticed this issue?
Nothing in life is to be feared, it is only to be understood.
The indicator looks interesting. The issue I have with it is once I have selected a currency pair I cant de-select that pair. So when I select all the pairs the indicator has all the values of every pair is showing on the indicator, and I cant deselect the pairs unless I close mt4. Anyone else noticed this issue?
The indicator looks interesting. The issue I have with it is once I have selected a currency pair I cant de-select that pair. So when I select all the pairs the indicator has all the values of every pair is showing on the indicator, and I cant deselect the pairs unless I close mt4. Anyone else noticed this issue?
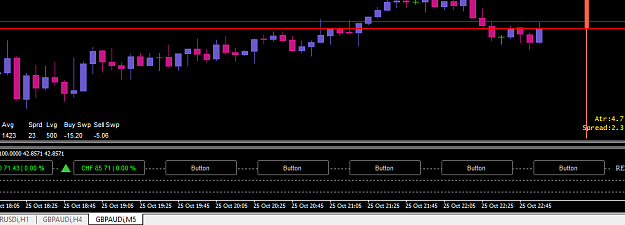
As you can see,the currency abbreviations and their values don't fit in the rectangles. Makes it difficult to see what currency I'm looking at. It's a problem I've had with other dashboards and indicators and I don't know how to fix it. If this indi works correctly on someone's charts, would you please send along a template? If I use your settings, that may solve my problem.
As you can see,the currency abbreviations and their values don't fit in the rectangles. Makes it difficult to see what currency I'm looking at. It's a problem I've had with other dashboards and indicators and I don't know how to fix it. If this indi works correctly on someone's charts, would you please send along a template? If I use your settings, that may solve my problem. {image}
Ignored
the code was been crash with other indicator with the sames formula
{quote} RAOG is all calculated of RSI with 28 pair , i give u some example : USDCAD RSI Value is 62% USDJPY RSI Value is 35% Thats mean USD Stronger VS CAD But Weakles VS JPY and the calculated of RAOG for USD is 62+35/2 = 48.5%