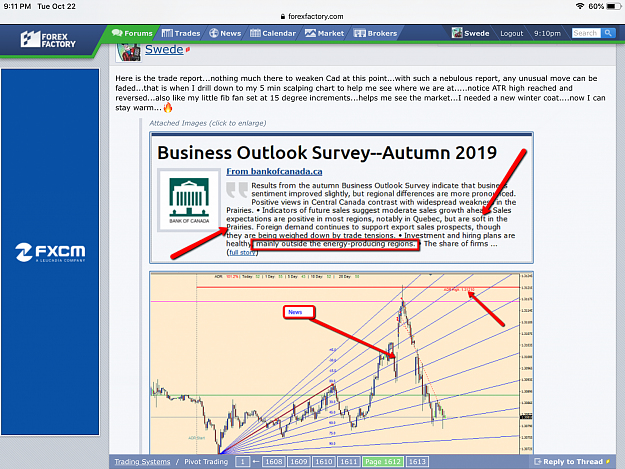
Yes Peter, There are so many safe entry points if one sets up the charts like the one above...that has always given me some challenge....it’s easy to spot support/resistance, but if you miss it where do you enter? Not hard to spot at all on this the chart...I used the same method today in the pivot room on a 5 min chart when Cad had some news....it was a work of art as far as I’m concerned ha ha, anyway speaking of wine...my favourites, maybe we will share a glass one day when I’m down south. I’m buying, I insist!
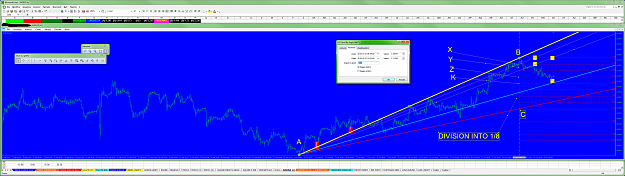
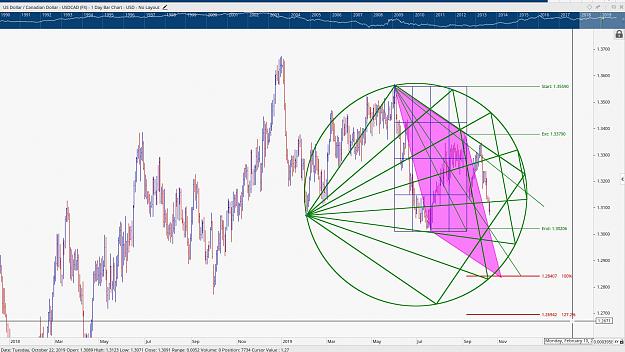
Here is an example of where DMG Diagonal Market Geometry has the possibility to see where time and price meet. Basically, the turns in the market were on target. Everyone wants to know where the turns are in the road because trading is like driving through mud sometimes. {image}
Ignored
Hi everyone,
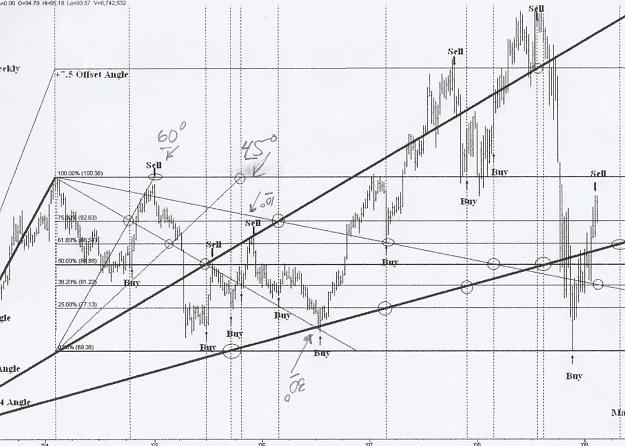
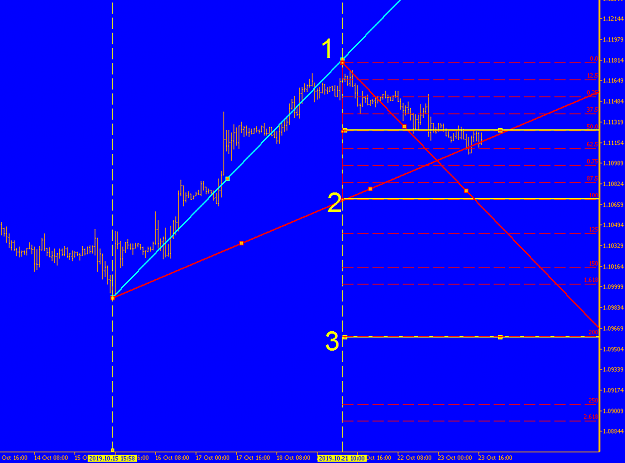
In an earlier post the picture below was used to demonstrate how one could forecast turning points. Now, I understand how the angles (Jenkins Secret Angle Method) and the support and resistance levels were created. What I have a problem with is to see how those lines translate into buy and sell signals.
I would be grateful if someone could explain why the vertical lines and circles are drawn where they are .
{quote} Hi everyone, In an earlier post the picture below was used to demonstrate how one could forecast turning points. Now, I understand how the angles (Jenkins Secret Angle Method) and the support and resistance levels were created. What I have a problem with is to see how those lines translate into buy and sell signals. I would be grateful if someone could explain why the vertical lines and circles are drawn where they are . Simon {image}
Ignored
Hi Simon,
please see my post n° 571, or if you have a scaled chart you must see angle of trendline LOW/ HIGH ....AB ( YELLOW)
divide it by 1/3...2/3..1/2..1/4...1/8
much important is obviously 1/2
then you divide distance BC into 1/8 (C is point angular trendline 1/2 connects below HIGH)
then connect LOW A to X,Y,Z,K...etc..etc
ok?
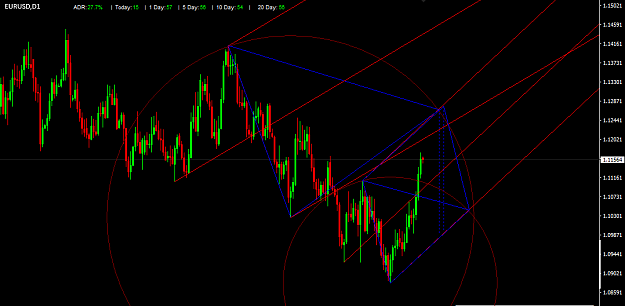
as you can see in my chart EURUSD 1H scaled chart AB is 23.7°, so my angular trendline 1/2 is 11.85 (RED) ....2/3 (LIGHT BLUE)
{quote} Hi Simon, please see my post n° 571, or if you have a scaled chart you must see angle of trendline LOW/ HIGH ....AB ( YELLOW) divide it by 1/3...2/3..1/2..1/4...1/8 much important is obviously 1/2 then you divide distance BC into 1/8 (C is point angular trendline 1/2 connects below HIGH) then connect LOW A to X,Y,Z,K...etc..etc ok? as you can see in my chart EURUSD 1H scaled chart AB is 23.7°, so my angular trendline 1/2 is 11.85 (RED) ....2/3 (LIGHT BLUE) {image}
Ignored
Thank you for your reply Carbon! I will try it out when I get back to my computer .
Remember the 45 Degree Rule: This little known but passed up rule can make you money.Most traders biggest problem is that they do not listen to what was just said. Fundiwambao and Swede picked it up the first time out of the gate.... I hope you do too. https://youtu.be/AOf9dy_veLM
Ignored
Hello DiamondMiner, I'm going through Jenkins' work and one time he mentions that offset angles work the best but because it's hard to draw them, he uses the grid method shown here most of the time. With the grid method he assumes the first leg is the is a 4x1 angle, and he says this assumption is correct 90% of the time. Well on tradingview it is very easy to draw the offset angles and I have been experimenting with them and what I found is that the firs leg is rarely a 4x1, it s rather somewhere between a 8x1 and a 4x1.
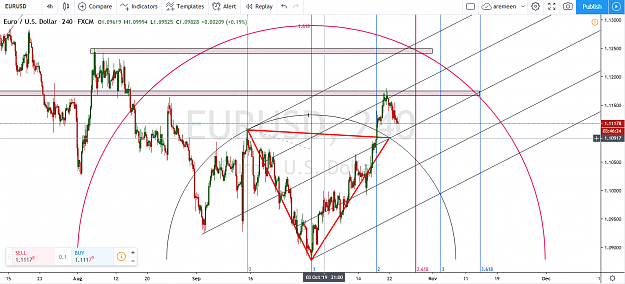
For example in the following BTC chart I used the highlighted green leg as the axis of inclination, then using an arc and a square I drew the offset angles. It turns out that the first leg is a 8x1 with this method. I then applied the grid on it and as you can see it did a pretty spectacular job of catching the small turn at 0.5 then the huge dump at 0.75 as well. Also the angles themselves were super solid S/R.
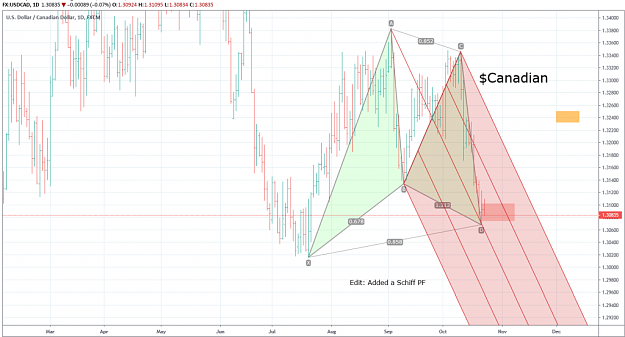
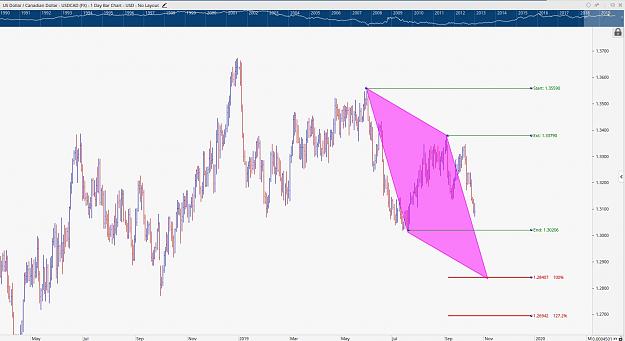
Lets see where this goes.... D point was a little lower than optimal but OK. Target zone marked. S. Edit: Schiff PF added. {image}
Ignored
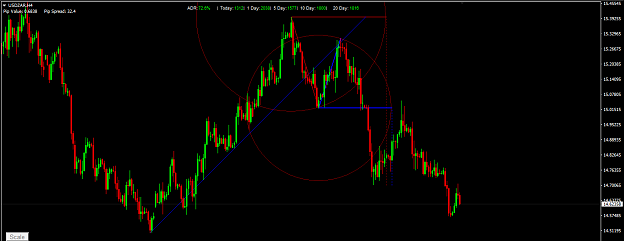
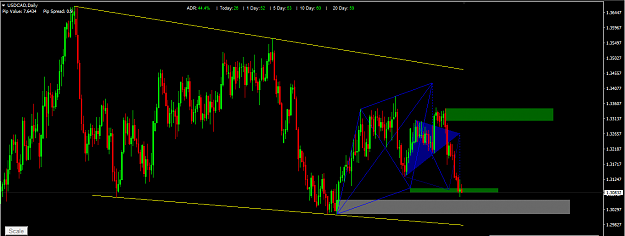
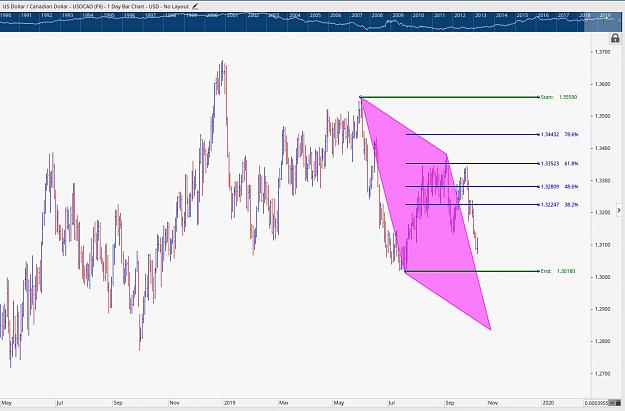
UC Daily with Quadrilateral and Price Extensions tool, give it a few days to see if it hits that level the quad and PE tool point at....
Attached Image (click to enlarge)
UC Daily with Quad with Price Retracements tool. It appears the Price Retracement tool and the Price Extensions tool agree cat 1.30180 but not with the Quad. Interesting to see just how it turns out.
Attached Image (click to enlarge)
You NEVER will be the person you could be, without pressure & discipline
{quote} Hello DiamondMiner, I'm going through Jenkins' work and one time he mentions that offset angles work the best but because it's hard to draw them, he uses the grid method shown here most of the time. With the grid method he assumes the first leg is the is a 4x1 angle, and he says this assumption is correct 90% of the time. Well on tradingview it is very easy to draw the offset angles and I have been experimenting with them and what I found is that the firs leg is rarely a 4x1, it s rather somewhere between a 8x1 and a 4x1. For example...
Ignored
Offset Angles are just a scaling change.
Most of our problems are linked to the question " What is the correct scaling I have to use ?"
Jenkins offset Angles are just a translation of the 90° Vertical Axis Price of the N° difference between the 90° Axis and the Trend Angle. Then you apply the same translation to all others 1/8 th Angles.
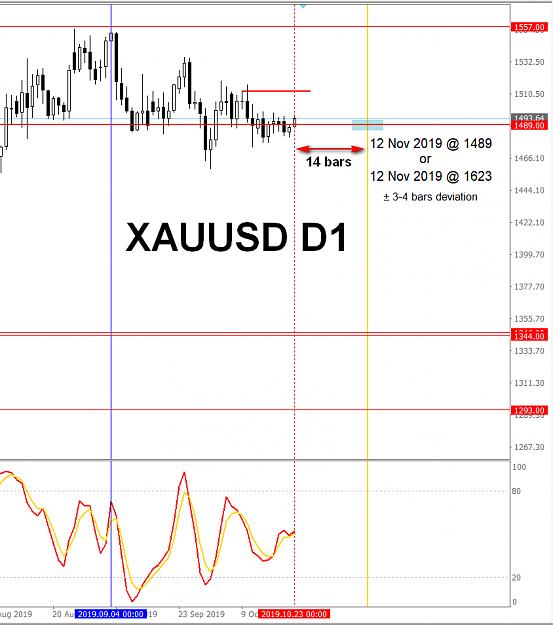
Tks Peter, Good pick up. Sometimes 1 1/2 eyes are better than 2. Closer inspection will show we are looking at substantially different time periods. If the pattern evolves it would be closer to a Butterfly one not a Gartley. This does suggest however that the BE is not just for Gartleys. Further investigation is surely warranted. What is not clear whether you are using calendar or trade days on the plot. This may make a difference in your timing dates projections and analysis. S.
Ignored
Steve666, correct, it's not a Gartley at all. Facts are the Beck's Emblem is Gartley Specific, so no joy. Throw me another one, I'm just sitting around waiting on the surgery come Friday.
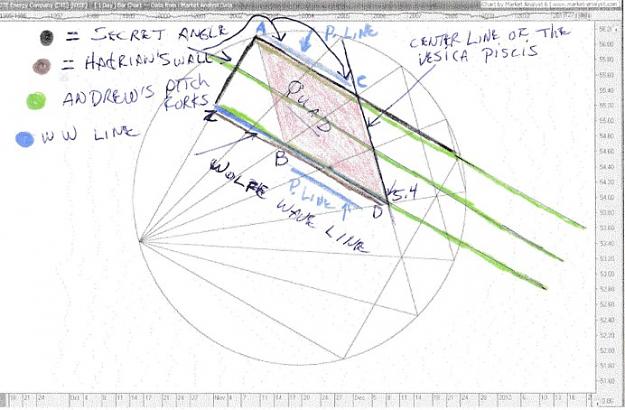
Shown below is a Grail trade with Secret Angle, Hadrian's Wall, Andrews Pitchforks, Wolf Wave Line, Quadrilateral, and Beck's Emblem and a Trend Reversal Gartley Pattern. Amazing how they all can interact with one another. Believe it or not on occasion that type of trade happens.
Attached Image (click to enlarge)
If someone would just stop what they are doing and just study this pic, they would learn so much. But... they won't.
You NEVER will be the person you could be, without pressure & discipline