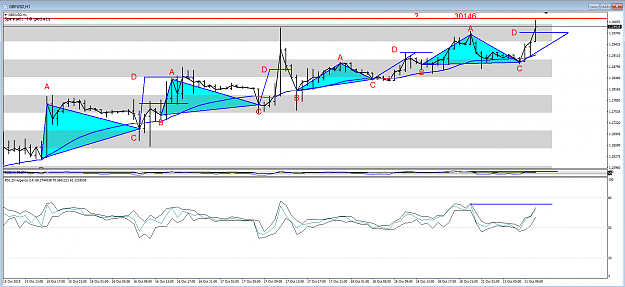
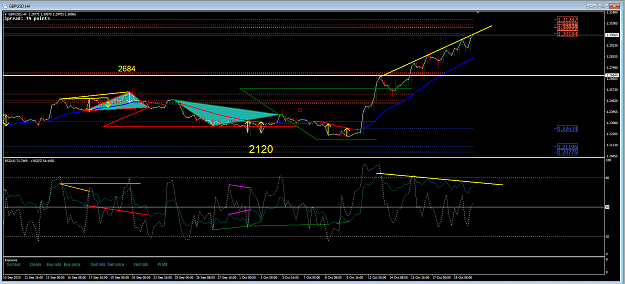
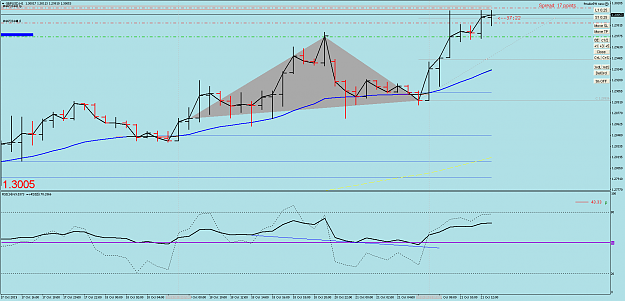
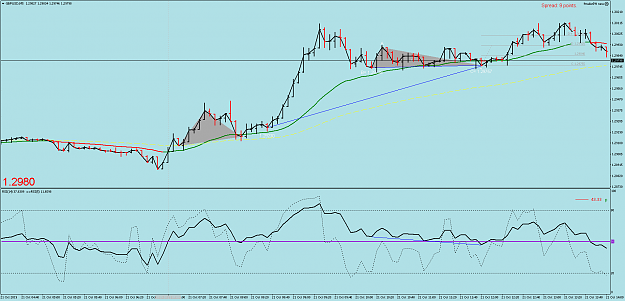
Romped it in. Now the 1 hour looks like testing the 30146 average swing high
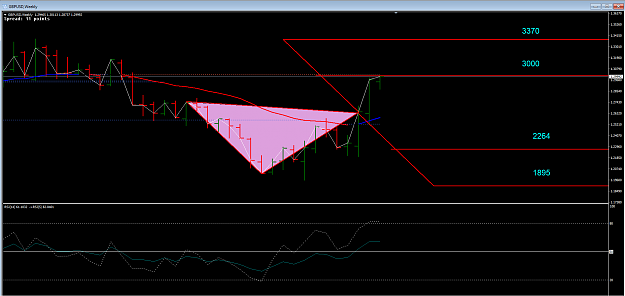
- #4,861
- Edited 3:31am Oct 21, 2019 3:20am | Edited 3:31am
- Joined Mar 2016 | Status: Trader | 6,378 Posts
Identifying Market Swings - Medium and Long Term Trading 619 replies
Trading With Moving Averages 72 replies
Moving Averages Zone Trading 10 replies
HELP! GMMA (Guppy's Multi-Moving Averages) Trading Mehod 3 replies
Via indicator: trading xxxyyy via zzz 0 replies
Disliked{quote} I don't use the H! for signals. I look at the higher time frames then drop to the 1 for an entry.Ignored
Dislikedsorry to ask Alan and i am probably completely wrong but on that last ABCD i can get no connection on my RSI to draw that pivot B like you do.Ignored
DislikedNo the big signal did not happen it became a 17 pip signal instead {image}Ignored
Disliked{quote} agree, confusing there, indeed the very low at 29233 wasn't under attack, looks like its now going to the ema swingIgnored
DislikedNo the big signal did not happen it became a 17 pip signal instead {image}Ignored
Disliked{quote} Alan, I too have the doubt, same as Huskyboy. As 29233 is not the pivot under attack, how can we expect it become a ABCD like you drew in the picture?Ignored
Disliked{quote} Oh, ok. But still I am confused about the ABCD in Alan's picture, where the pivot under attack is far away.Ignored
Disliked{quote} Kevin hope this helps, C was not attacking the 1,29230 but was attacking the 1,29738 (B) so that gave the ABCD confirmed with the RSI{image}Ignored
Disliked{quote} Ok, thanks for clarifying it for me. I still am confused about one thing. What's the role of 1.29230 here?Ignored