Hi,
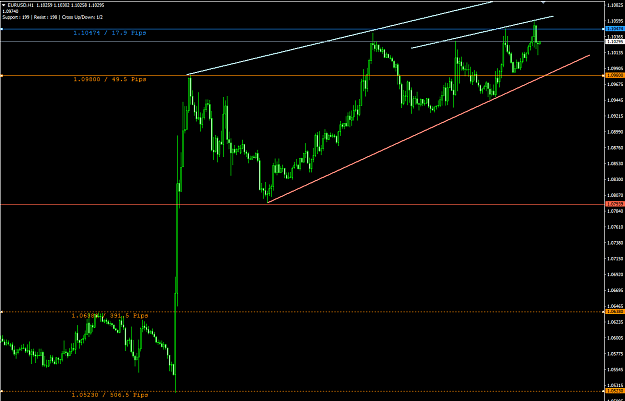
I wonder if possible to code an indicator that will change the colour of manually drawn horizontal lines automatically, to detect when the current price is
above or below them ?
Would be a nice solution to spot when support becomes resistance & vice versa.
Thanks.
I wonder if possible to code an indicator that will change the colour of manually drawn horizontal lines automatically, to detect when the current price is
above or below them ?
Would be a nice solution to spot when support becomes resistance & vice versa.
Thanks.
It never gets easier, you just get better