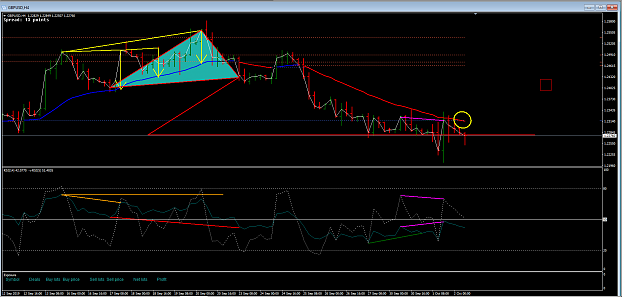
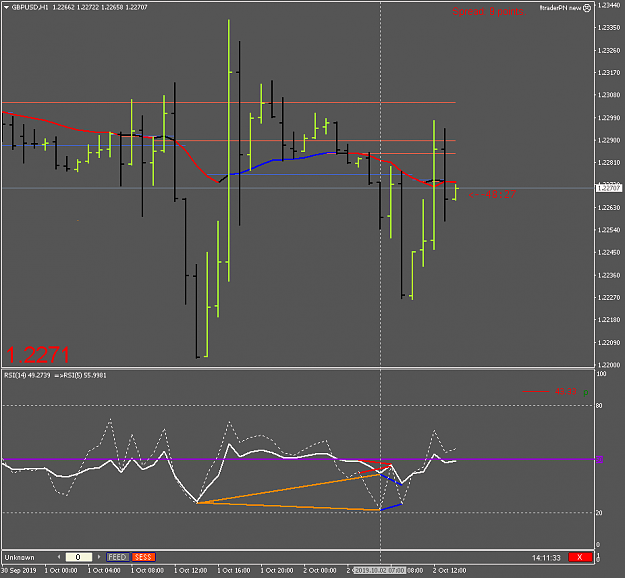
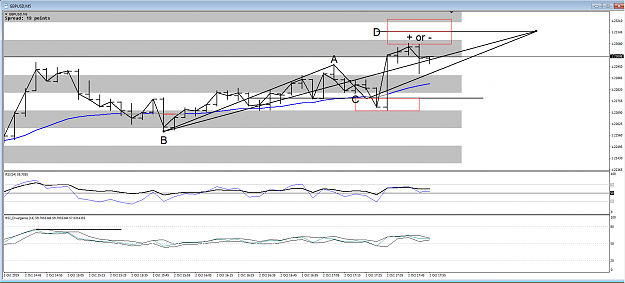
And so after a bit of a tussle the bears made the 4 hour average LL. Looks like quite a performance for that big green bar but to no avail as the bulls ran into divergence.
Identifying Market Swings - Medium and Long Term Trading 619 replies
Trading With Moving Averages 72 replies
Moving Averages Zone Trading 10 replies
HELP! GMMA (Guppy's Multi-Moving Averages) Trading Mehod 3 replies
Via indicator: trading xxxyyy via zzz 0 replies
DislikedAB=CD target from Yesterday played out this morning on the H1 {image}Ignored
This chart of your 1 hour was drawn incorrectly.
I have drawn it for you below.
Disliked{quote} This chart of your 1 hour was drawn incorrectly. I have drawn it for you below. {image}Ignored
Disliked{quote} This drawing is completely wrong. You do not have a pivot at A?Ignored
Disliked{quote} Ouch, back to the drawing board for me. More study required. Sorry everyone for spamming the board. Alan thanks for the feedback, much appreciatedIgnored
Disliked{quote} Ok just a regular Div no ABCD. So A and B have to be a pivot, C does not have to be a pivot. But A must be the opposite side of the EMA to B. Thanks again Alan. I will keep tryingIgnored
Disliked{quote} This chart of your 1 hour was drawn incorrectly. I have drawn it for you below. {image}Ignored
Disliked{quote}Thx Alan but just one question, i can see that the A and B are drawn at its high and low of its bar, and C at the close off the bar? Not a rule about that, i thought we only looked at the closes of the bars?Ignored