{quote} i see the m15 chart on XBR has got that pattern you pointed out on gold with the shoulder and head setup, is there a reason why you arent trading it on this pair?
Ignored
Are you referring to the inverse head and shoulders? I wasnt on the lower time frame, i missed that, and its actually near a weekly S1 handle....nice pick up, did you trade it? i see it did bounce off a little, but that weekly S1 handle was tested yesterday and pice has come back towards it and still trading near the daily pivot, will look at it, im also not selling these minor bounces as we are at these weekly support handles so hoping to get my buy order filled later on failing which i will wait and see on Monday..
{quote} Are you referring to the inverse head and shoulders? I wasnt on the lower time frame, i missed that, and its actually near a weekly S1 handle....nice pick up, did you trade it? i see it did bounce off a little, but that weekly S1 handle was tested yesterday and pice has come back towards it and still trading near the daily pivot, will look at it, im also not selling these minor bounces as we are at these weekly support handles so hoping to get my buy order filled later on failing which i will wait and see on Monday.. Trade safe
Ignored
I dont want to risk my profits for the month, had a good month so will continue in the new month again, i was just curious...thanks my man
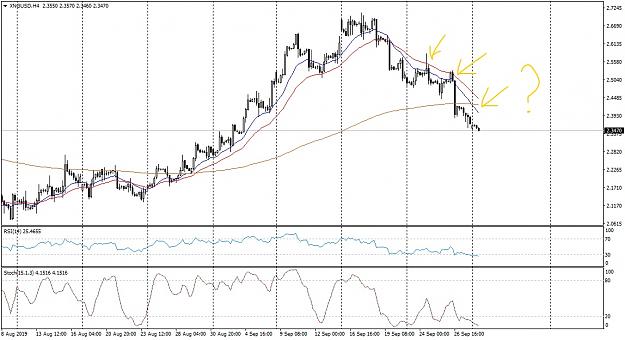
XNGUSD Natural Gas Looking for price to drift back towards the 2.42 handle to look for shorts towards 2.1826 handle. Other levels of interest for the week are 2.4951 2.4695 2.4439 Key Moving average also currently sits in the sell area/zone, so will give it a shot.. {image}
Ignored
Do you think we are seeing a trend reversal or just consolidation/retracement?
Personally I find it hard to believe the rally is over.
{quote} Do you think we are seeing a trend reversal or just consolidation/retracement? Personally I find it hard to believe the rally is over.
Ignored
Well, if you look at the daily chart and plot the fibs, you will see price is testing that 61.8 mark...
Daily has been bearish for some time and so has H4...so if anything am looking at the dip towards that possible daily right shoulder of what would be an Inverse HnS....invalidation of the head handle will confirm the change in trend and the continuation of the downward trend thats been taking place through-out the year....
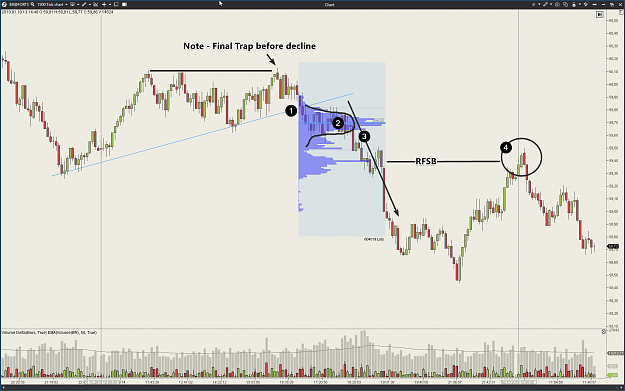
I call it Test of RFSB, it formed on Brent oil futures market several hours before, but you can find it every day.
Attached Image (click to enlarge)
The first chart is telling the global view (1 candle = 1500 ticks). You can see on chart #1:
1) the breaking down of line A.
2) consolidation zone after break-down of A
3) development of the Selling Wave with big bearish effort around 59.40. Plot RFSB here.
The idea behind the testing RFSB - is to knock out bears who joined the selling wave from good positions. Test means that -> the market makes back move up in order to trigger SLs of bears placed around the breakeven level. As you can see on the profile, we had a spike of activity at 59.40 level. So, point #4 - is the "test" of RFSB and knocking out sellers from a falling market.
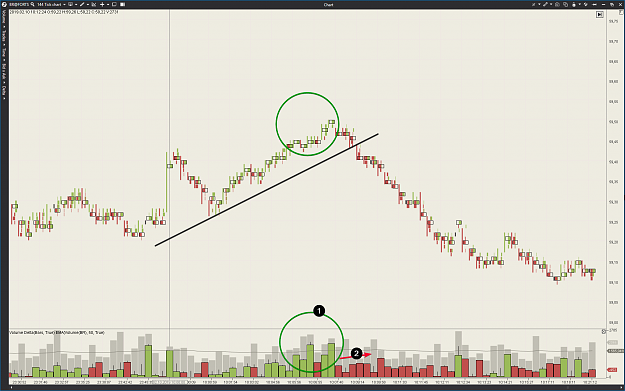
Now, look at chart #2. This is footprint (1 candle = 144 ticks). We need to find the best moment to open a short position.
Attached Image (click to enlarge)
1) Abnormal Buying during testing of RFSB on faster TF. Green Clusters = Many Existing Shorts are Stopping-Out. Market Fooled that Sellers. Thereby, it lost its interest to go further up.
2) That is why selling pressure appears (Pure Genuine Supply). Price starts to decline amid the red Delta = bearish behavior.
A period of transition from 1 to 2 = the rational moment to enter shorts with applying your personal Capital Management Rules.
Oleg Alexandrov, market analyst. Find me in Google
Setup for short. I call it Test of RFSB, it formed on Brent oil futures market several hours before, but you can find it every day. {image} The first chart is telling the global view (1 candle = 1500 ticks). You can see on chart #1: 1) the breaking down of line A. 2) consolidation zone after break-down of A 3) development of the Selling Wave with big bearish effort around 59.40. Plot RFSB here. The idea behind the testing RFSB - is to knock out bears who joined the selling wave from good positions. Test means that -> the market makes back move up...
Ignored
Yeah Bud, you called it, it was showing some signs of a pullback earlier on in during the London session, infact i had wanted to join the bears on monday as it was dipping, but it dropped without my short orders getting filled....