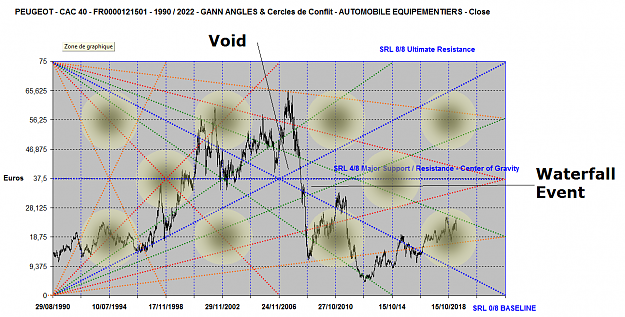
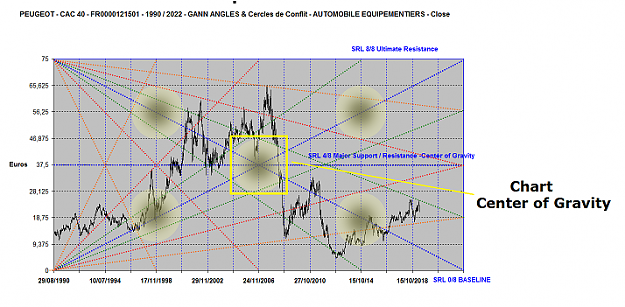
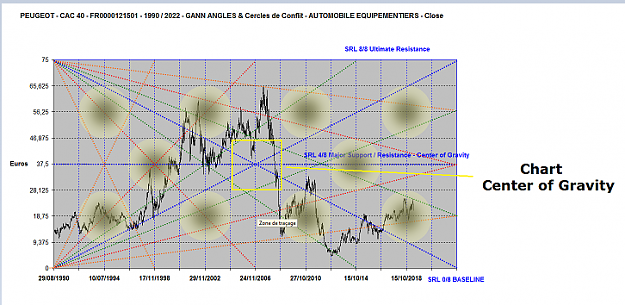
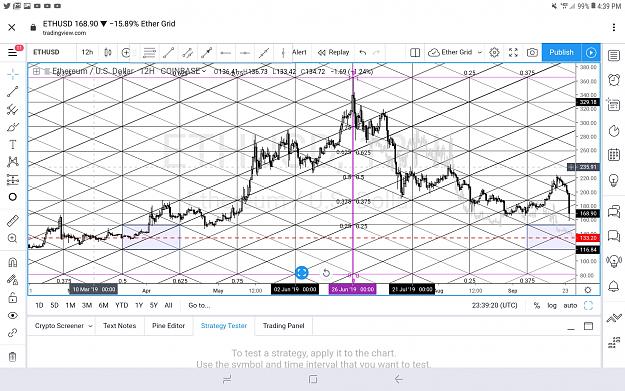
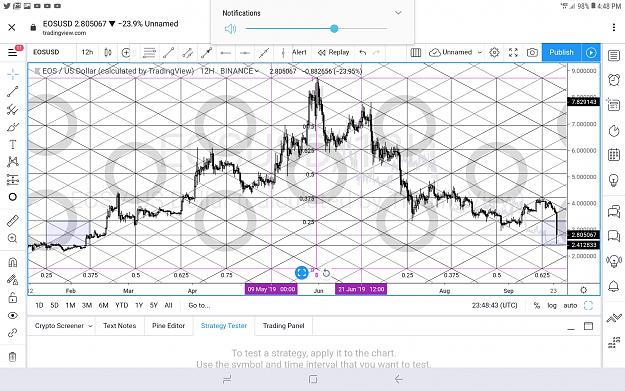
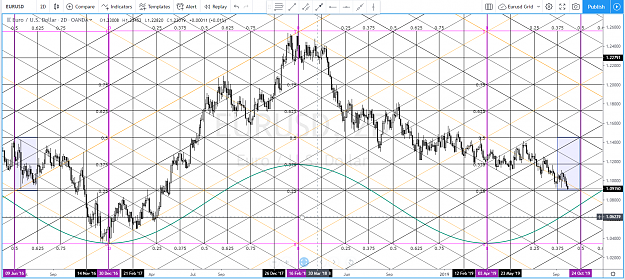
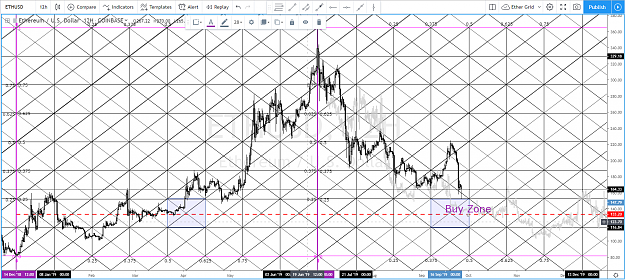
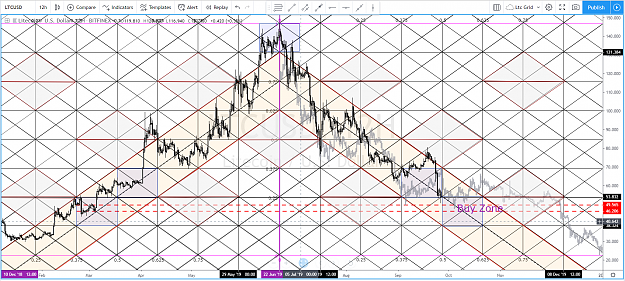
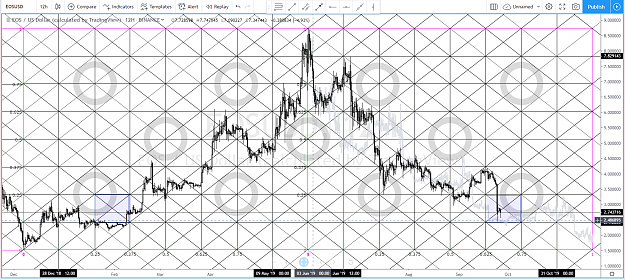
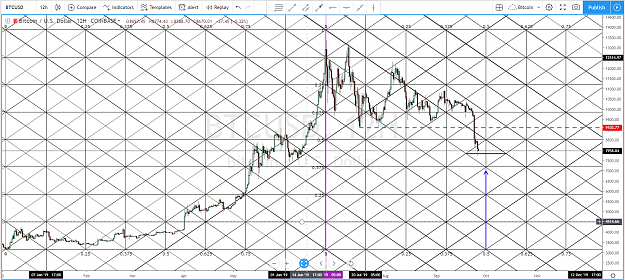
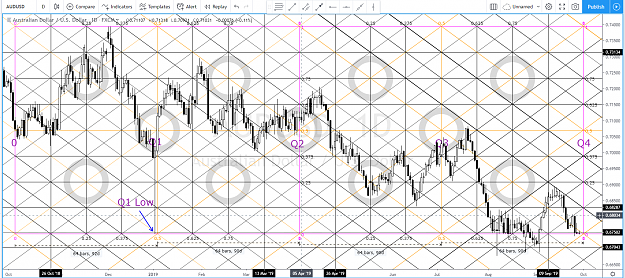
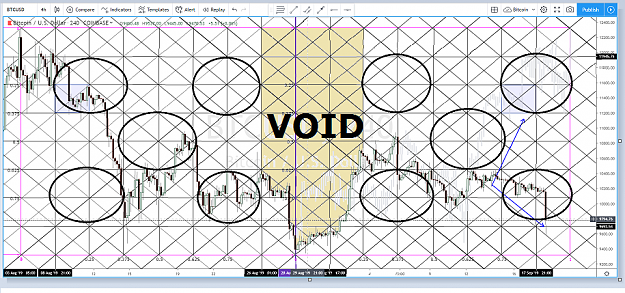
Very often you can observe this "void" between 2 series of Circles of Conflict
Within this "void" area Price Action goes UP or Down without Resistance
2
Gann angles forecasting Method and SHIBA INU 0 replies
All the Forecasting and Prediction indicators on the market? 18 replies
Economic Indicator Forecasting by Banks: Why and how 4 replies
Anticipation vs. Forecasting 0 replies
Disliked{quote} Hallo, I best explain using a chart Make a spreadsheet. List the Fibonacci series numbers ( I have the first ten, starting from 2 to 144 ). Get their square roots. After getting the base number (my own term), e.g. 14 in chart below, multiply 14 by square roots of Fib numbers ( "harmonics" ) Also, make other columns where you multiply 14 by Fib ratios ( 1.618, 1.236, etc ), and also you can multiply the harmonics by same ratios You will end up with a matrix, and these are candles from the start point where price & time come together NB: I'm...Ignored