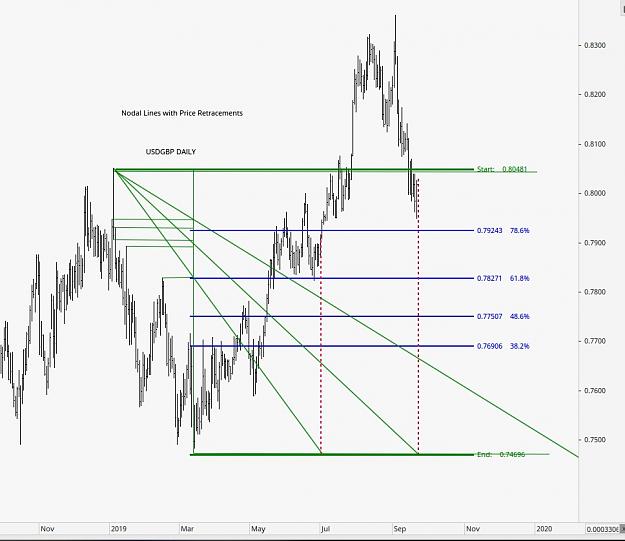
{quote} Hallo, I best explain using a chart Make a spreadsheet. List the Fibonacci series numbers ( I have the first ten, starting from 2 to 144 ). Get their square roots. After getting the base number (my own term), e.g. 14 in chart below, multiply 14 by square roots of Fib numbers ( "harmonics" ) Also, make other columns where you multiply 14 by Fib ratios ( 1.618, 1.236, etc ), and also you can multiply the harmonics by same ratios You will end up with a matrix, and these are candles from the start point where price & time come together NB: I'm...
Ignored
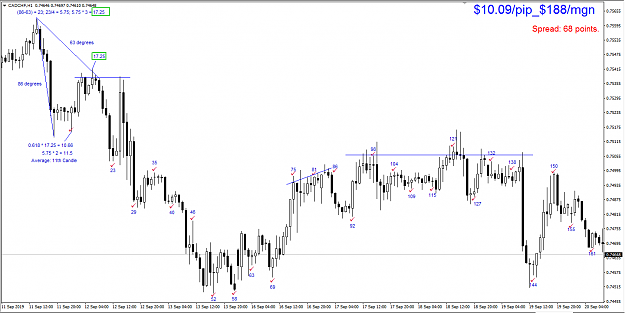
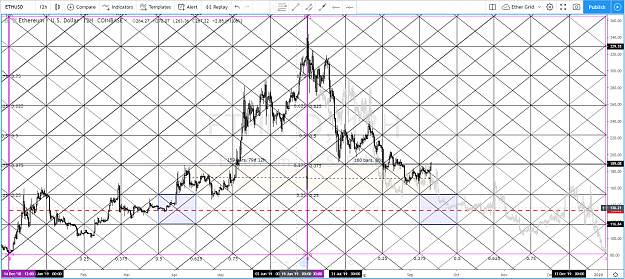
This next chart doesn't have any of the square root or Fib ratio multiples
This is purely the smaller 'fractal' of the base number, derived from the difference in first wave degrees
86 - 63 = 23 degrees
23 / 4 = 5.75 --------> 'fractal'
5.75 * 3 = 17.25 ( 'base number' )
[ PS: why 3? why multiples of 2/4/8? because they recur alot (in nature and in price), etc, etc...and because they seem to work regardless of pair]
Note: 17.25 * 3 ~= 52 (bottom of swing)
Chart marked in increments of 5.75 (rounded up where necessary). Pretty decent...
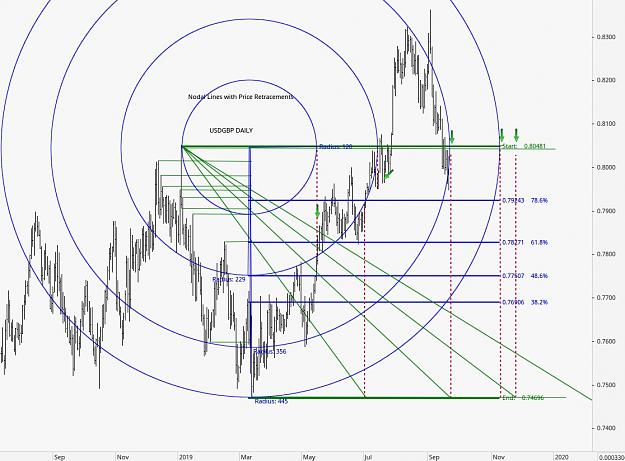
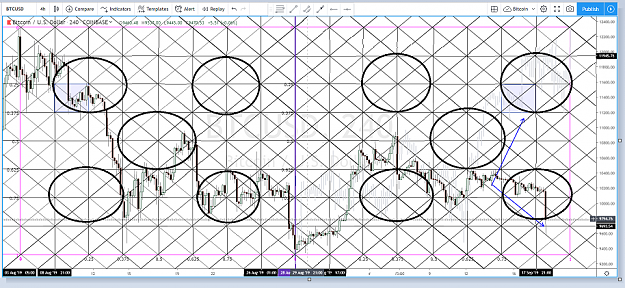
How to build Circles of Conflict 8 Time Intervals 8 Price Intervals {image} {image}
Ignored
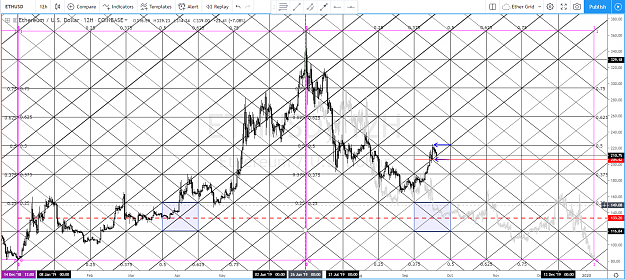
I've been tracking this chart for a couple of weeks. Decided to add the circles, I would have preferred to filled the quadrilaterals, but i don't have the shape, and it takes too long to do it with triangles. Working pretty well with the natural TLs and vertical turn points as well
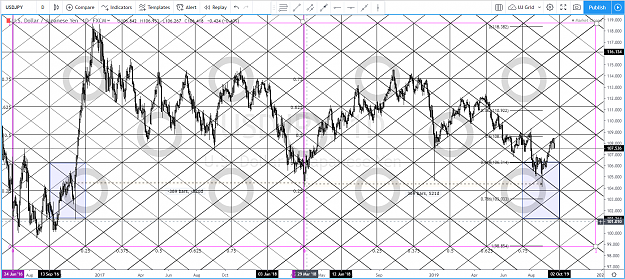
This was a perfect example of recent price and time on Usdjpy. Looking for a bigger move to the downside to come back into alignment. I also did this one differently. Instead of using a swing from high to low, or low to high. I ran a grid off swing low to swing low. You can see from mid-point low we recently hit the exact price point 369 bars later. We were at that exact price at 369 bars before the low. Also something a little interesting on this, since I just added the circles to this chart, to compare. On the other charts, price seemed to avoid the circles. On this it seems like it is pulling to them, tagging them along the way. I'm wondering if that is normal throughout the sequence???
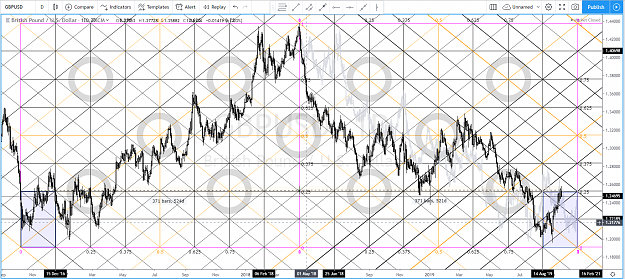
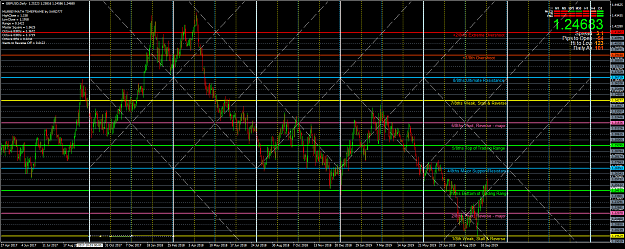
Gbpusd. I just did this one. I really wish I hadn't deleted all of the charts I used to have. At one point I had almost all major crosses laid out, but found myself spending too much time over-analyzing things, and not enough on actually trading. Anyway, this one is almost timing out on this swing, but you can see we are at exact price and time from the highs of what I call the mother swing. 371 bars from highs present and past. Are we preparing for a turning point soon is the question??
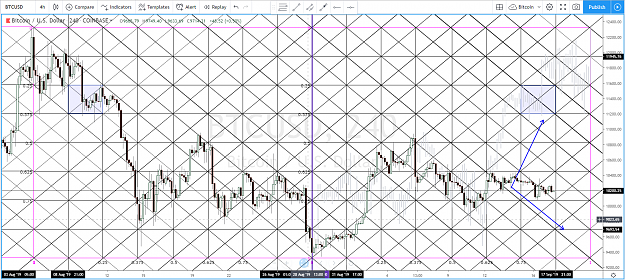
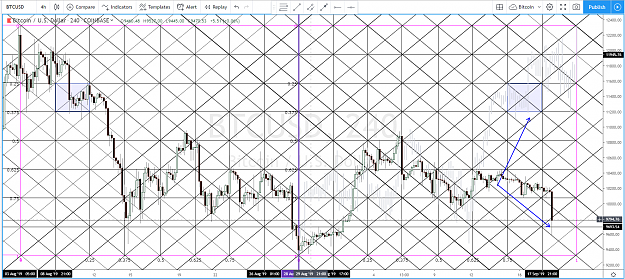
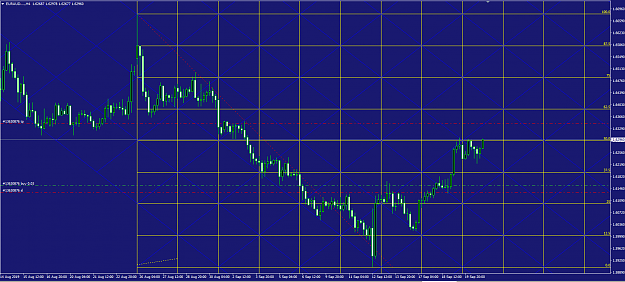
Here is one I was trying on a smaller TF that failed. But as you can see I had pointed in two possible areas that I expected to see price moved to. Even though I wanted to see price move to the upside, and get back into symmetry. It is not uncommon to see more of an inverse move. The first chart was a few days ago, before the move
Alain
Remember our conversations
A grid needs
A start date
A number of set cycles 256 128 64 etc
A number of set levels 3.125, 1.5625. 0.78125 etc
This is very rough MT4 not ideal
hereunder some thoughts of Tim Kruzel on Time and on the Starting Date
Time
The term "square in time" has been used liberally throughout the prior discussions without any specific statements regarding time. All that has been addressed so far is the vertical price dimension of the square in time. This is justified since the process of identifying the MML's and MMI's requires a little more effort than the divisions of time.
The fact that less discussion has been devoted to the time dimension should not be interpreted to mean that the time dimension is any less important than the price dimension.
Time and price are equally important.
Time is divided up in a very reasonable (and practical manner). The year is broken into quarters of 64 trading days each. Note that 64 is a power of 2 (i.e. (2 x 2 x 2) x (2 x 2 x 2) = 8 x 8 = 64). An interval of 64 can easily be subdivided into half intervals. Note that 8 (the number of vertical intervals in the square in time) is also a power of 2 (i.e. (2 x 2 x 2) = 8).
Thus, the square in time can easily be scaled in both the price (vertical) and the time (horizontal) dimensions simply by multiplying or dividing by 2 (very clever).
Consider also that a year consists of four quarters. Four is also a power of 2. So, a square in time based upon a year long scale can also easily be subdivided.
The ability to subdivide the square in time gives the square in time the ability to evolve as an entity trades through time. The square in time acts as a reference frame (coordinate system) that can adjust itself as needed. As an entity reaches new high or low prices, the reference frame can be expanded by doubling the square in both the price and time dimensions. Alternatively, if one wishes to look at the price of an entity during some short time frame one can simply halve the square in both the price and time dimensions (resulting in a quarter square). This halving and doubling may be carried out to whatever degree is practical (i.e. Practical within the limits of how much price and time data may be subdivided. A daily chart can't be subdivided into intraday prices or time). Refer back to the description of the rectangular fractal at the beginning of this paper.
The argument for breaking the year into quarters intuitively makes sense. The business world (including mutual fund managers) is measured on a quarterly basis. Each of the four quarters roughly correspond to the four seasons of the year which drive weather and agriculture (as well as commodity contracts). Clearly humans are geared to a quarterly cycle.
Murrey resets the time = 0 point on an annual basis. This is done the first week of October and corresponds to the day of the U.S. Treasury's monthly and quarterly bond auctions (This year 10/8/97). Once the time = 0 point is set one may simply count off daily increments of 4, 8, 16, 32, or 64 days relative to the time = 0 point to set the desired square in time (or 256 days if one wants an annual chart).
At this point one should realize that specifying a time interval is critical to setting up the square in time. In the above examples that were used to illustrate the selection of MML's and MMI's the time frame was implied. All that was specified in the examples was the price range that the entity traded at. Naturally, one has to ask the question, "The price range it traded at during what time frame?". One will probably want to set up the square in time for annual and quarterly time frames. The quarterly square in time will probably be subdivided into a 16 day time frame for intermediate term trading.
One would need intraday data to set up an intraday square in time. The time coordinate of an intraday chart is simply divided into 4 or 8 uniform intervals. The intraday MML's and MMI's are then set up using the intraday trading range. If one is looking at a weekly chart then a quarter should consist of 13 weeks.
Another key use of the time dimension is estimating when a trend in price will reverse itself. The horizontal MML's of a square in time represent points of support and resistance in the price dimension. The vertical lines that divide the square in the time dimension represent likely trend reversal points. My own personal studies, done on the DJIA, showed that on average the DJIA has a turning point every 2.5 days. Since we know that the market does not move in a straight line we would expect to see frequent trend reversals.
Murrey uses the vertical time lines (1/8 th lines) in the square to signal trend reversals.
Alain Remember our conversations A grid needs A start date A number of set cycles 256 128 64 etc A number of set levels 3.125, 1.5625. 0.78125 etc This is very rough MT4 not ideal {image}
Ignored
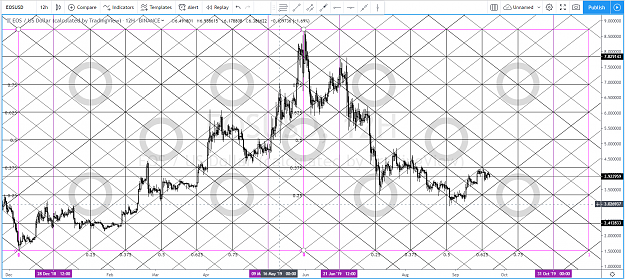
It might be possible, that once you have your horizontal and vertical lines setup. You could go into the Gann section under insert. Try using the Gann Grid base off your first square. This might work??
Here I did a quick example, it should work. I done have the Murrey Indi you have. So I quickly changed my fib levels to represent 1/8s, but by percentage for horizontal levels. Then I used the cycle line to make my rough timing/vertical levels. These are not exact, I was just making a general square. Then took the Gann Grid tool, and went from one corner to the next, in a diagonal for a quick grid, with exact spacing across the chart. Hopefully this helps
The Grid also lays out natural S/R levels, as well as TLs and channels. As price breaks through a S/R level, I generally expect price to hit at least the next mid level, possibly a full deviation up or down, depending which way it broke. Which would be 50% level, where TLs cross of the next Quadrant or deviation, or the next S/R level/horitzontal. Here is a post, where I was looking for a possible move to the upside, and Quad level S/R targets. As well as how it played out. Notice how price is bounce off natural TLs and levels
hereunder some thoughts of Tim Kruzel on Time and on the Starting Date Time The term "square in time" has been used liberally throughout the prior discussions without any specific statements regarding time. All that has been addressed so far is the vertical price dimension of the square in time. This is justified since the process of identifying the MML's and MMI's requires a little more effort than the divisions of time. The fact that less discussion has been devoted to the time dimension should not be interpreted to mean that the time dimension...
Ignored
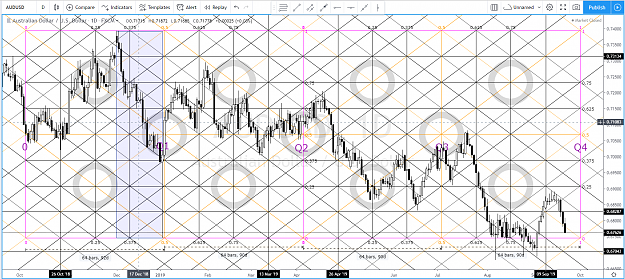
Very interesting!! I've broken down the Audusd, based off this theory. Using October as Q1 or 0. One point that breaking it down over a year through 64 bar increments, leaves us a couple trading days short for the year?? Anyway for price, since I am dealing with the past. I used the Q1 price range H/L. This is how it broke down. The most interesting thing here is, price was pretty much back to the price of 0 at the end of each Q. And cyclically returned in Price Time in the quadrants. Also note, I have broken it to 1/16s from a timing perspective. Meaning each vertical lines are every 16 bars. Another note, the Q1 price range has pretty much been the price range for the year at this point