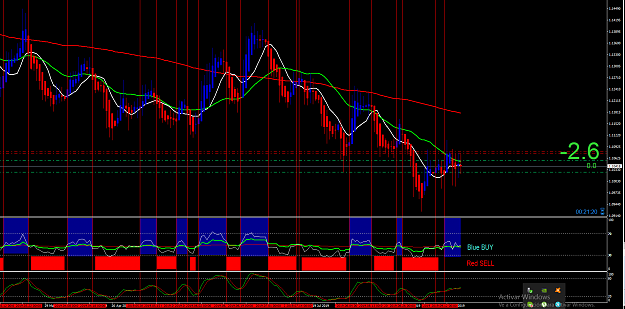
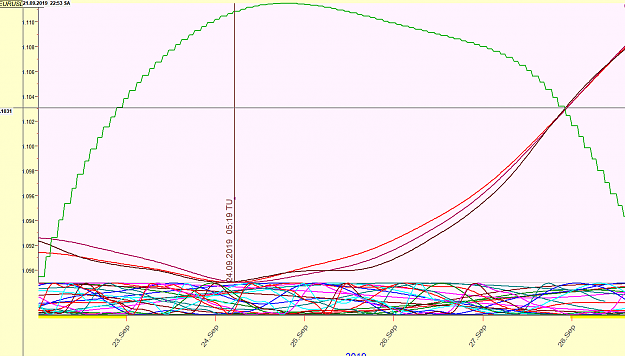
Disliked{quote} OK thanks. But following any astrological signal, I only enter the market if the indicators indicate so. In a 4-hour chart and at the opening of the London market for EURUSD or at the opening of Wall Street for DJIA. I do not expect any turning point if the RSI does not tell me and the stochastic confirms the trend. Then, following his chart today, he would only enter the market short if the 10-session mobile average in pale blue crosses the 128-session moving average down. And with RSI going down from 50. At the opening of London and on a 4-hour chart. .Ignored
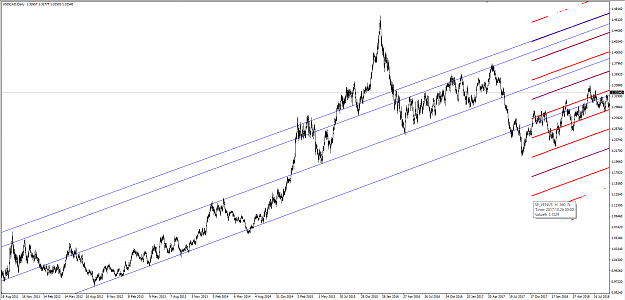
EURUSD
Following the system outlined above.
1. Bearish astrological prediction.
2. Bear chart. We had to wait several hours until the opening of London.
RSI -50
Stochastic with a downward trend.
Good SHORT input signal when crossing the price with the blue line.
The most useful market for Forex is the London market. It is the market with the highest volume.
Attached Image (click to enlarge)
![Click to Enlarge
Name: 2019-09-16 16_15_05-2100063482_ Darwinex-Live - [EURUSD,H4].png
Size: 104 KB](/attachment/image/3441020/thumbnail?d=1568650576)
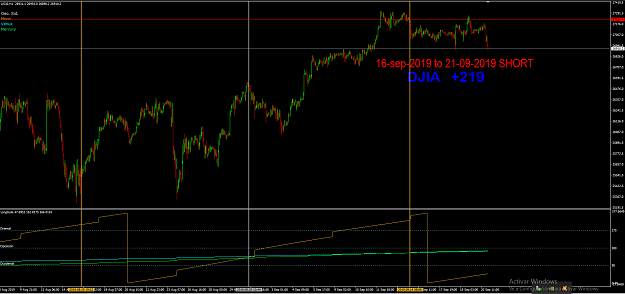
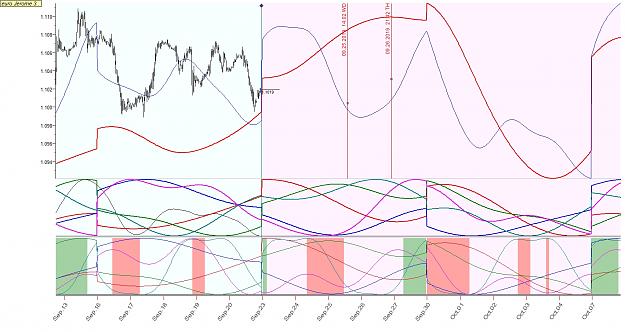
DJIA
System:
1. Astrological forecast bearish.
2. But on the chart with no input signal. OUT.
Explanation:
Price crossing the light blue line. But far from the dark blue line.
Stochastic upward.
Parameters:
Chart 1D:
EMA 128 sessions dark blue line.
EMA 10 sessions light blue line.
RSI 10 periods.
Stochastic 22,3,3.
Chart 4H:
EMA 128 sessions dark blue line.
EMA 10 sessions light blue line.
RSI 10 periods.
Stochastic 8.3.3.
Attached Image (click to enlarge)
![Click to Enlarge
Name: 2019-09-16 16_25_09-2100063482_ Darwinex-Live - [WS30,H4].png
Size: 98 KB](/attachment/image/3441028/thumbnail?d=1568651157)
.
1
![Click to Enlarge
Name: 2019-09-18 18_50_30-2100063482_ Darwinex-Live - [GDAXI,Daily].png
Size: 72 KB](/attachment/image/3443174/thumbnail?d=1568832763)
![Click to Enlarge
Name: 2019-09-18 21_36_07-103277_ IG-LIVE - [SWE30,Daily].png
Size: 80 KB](/attachment/image/3443330/thumbnail?d=1568842649)
![Click to Enlarge
Name: 2019-09-18 19_46_41-103277_ IG-LIVE - [EUSTX50,Daily].png
Size: 49 KB](/attachment/image/3443241/thumbnail?d=1568836082)
![Click to Enlarge
Name: 2019-09-18 20_22_26-103277_ IG-LIVE - [EURAUD,Daily].png
Size: 64 KB](/attachment/image/3443281/thumbnail?d=1568838309)