{quote} good job,whats your opinion now after 250 trade with this system?
Ignored
Can´t tell for sure since you trade it a bit different. My entry is delayed after a candle since I trade the 1st retracement after arrow But from what I have seen on M15, looks good and simple. Benefit of it is that, except for different brokers, everyone should get same trades, SLs and TPs. So very mechanical.
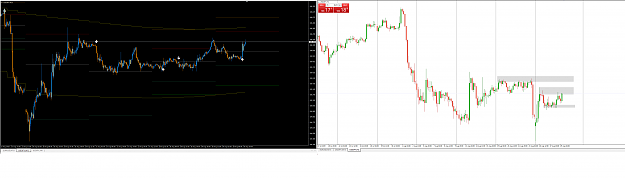
Thanks BTM for your system. I am just curious cause i read most of but not all the post. If there anyone that tired having two indicator D one set to 4 hr and one set to 15 min to look for spike entries or trend confirmation? {image}
Ignored
it is up to you,you can load D indicator as many as you want or even combine this strategy with your strategy,but if you could improve this system after your test you must share your idea and teach here IF you want to post your trade or result here that take based on your new improvement .
{quote} Can´t tell for sure since you trade it a bit different. My entry is delayed after a candle since I trade the 1st retracement after arrow But from what I have seen on M15, looks good and simple. Benefit of it is that, except for different brokers, everyone should get same trades, SLs and TPs. So very mechanical.
Ignored
good to hear that.the broker problem that i dont know what to do about it, because brokers get their data chart from different liquidity that may have some pips different broker to broker . the best solution i think,we check our broker,if all of us with broker 1 and 2 and 3 and 4 get same signal but broker 5 no signal,we can ignore broker 5,or we can use one of broker 1-4 for get signal and trade on whatever broker that we want.
im open for other solution guys...
{quote} it is up to you,you can load D indicator as many as you want or even combine this strategy with your strategy,but if you could improve this system after your test you must share your idea and teach here IF you want to post your trade or result here that take based on your new improvement .
Ignored
Definitely BTM, i have an Ea that i have been using for a very long time and i have been thinking of replacing the core strategy.
Let me place around with settings and see if i can automate it. If i have any results i will contribute here as well.
Thanks for the dashboard, it's a great help to find trades (and to minimize CPU load )
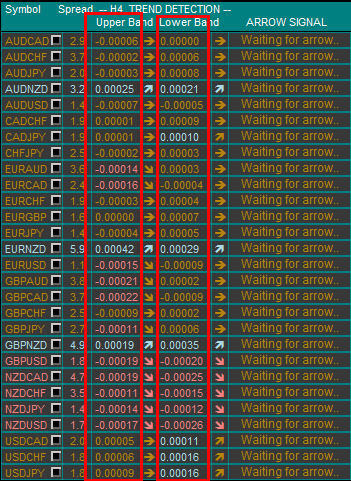
I have a question concerning the values of trend band in the dashboard :
Attached Image
We are in a trend when these values are above 0.00010 or below -0.00010
Don't we miss a lot of trades with this limitation ? expecially those at the beginning of a trend ? or on pairs where these values will rarely exceed these limits.
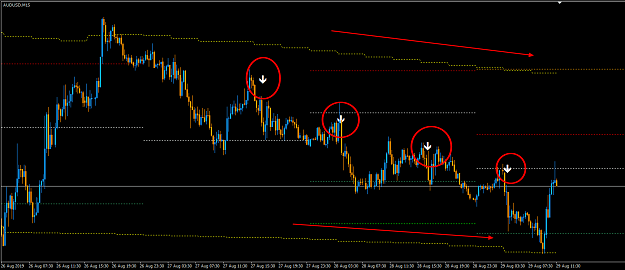
like on AUDUSD for example where we don't have alert on those potential trades :
Attached Image (click to enlarge)
Would it be possible in the dashboard's parameters to change the value of these limits ?
{quote} Definitely BTM, i have an Ea that i have been using for a very long time and i have been thinking of replacing the core strategy. Let me place around with settings and see if i can automate it. If i have any results i will contribute here as well. Cheers BTM
Ignored
its kind of that you help here to make ea,i personally trade manually and dashboard created by Zed.fr (thank to him) because of other need that and requested,so if ea can help other too,i will be happy to see it here.thank you again.
Hi BTM and zed.fr, Thanks for the dashboard, it's a great help to find trades (and to minimize CPU load ) I have a question concerning the values of trend band in the dashboard : {image} We are in a trend when these values are above 0.00010 or below -0.00010 Don't we miss a lot of trades with this limitation ? expecially those at the beginning of a trend ? or on pairs where these values will rarely exceed these limits. like on AUDUSD for example where we don't have alert on those potential trades : {image} Would it be possible in the dashboard's...
Ignored
Zed.fr (https://www.forexfactory.com/zed.fr) where are you man ,come here need some help here.
Thank you for the dashboard, it's make it so much easier to see all the pairs at a glance.
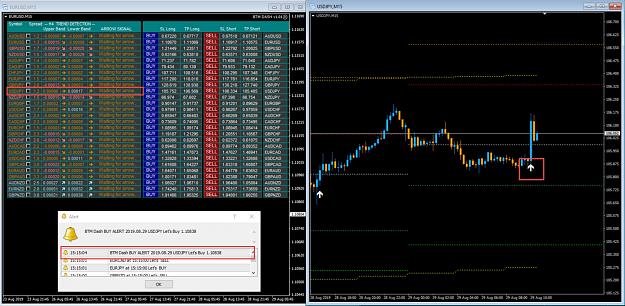
I need some help here. I followed the step by step installation guide by BTW. I get an Alert (e.g USDJPY) in the pop up. When the candle closed, there was an UP ARROW on the 15min USDJPY chart. But the Dashboard USDJPY ARROW Signal is still showing "Waiting for Arrow".
Is it some setting on my Dashboard BTW DASH v1.01 EA that I did not set properly?
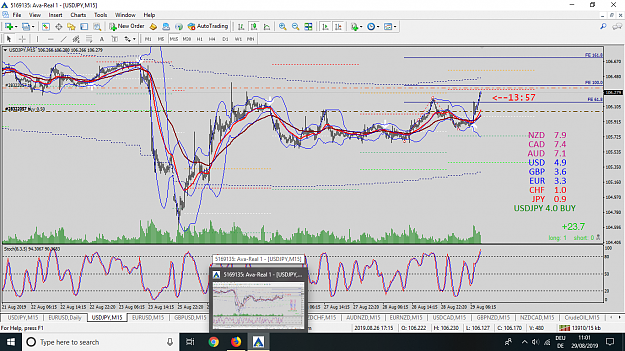
[quote = rrr2010; 12471516] Привет, ребята, кто-нибудь в UJ покупает? {} Изображение [/ цитата] Hi, I think there is a risk in this deal. If we look at the H4 timeframe, we will see how the price moves in the channel. Correct me if I'm wrong {image}
Ignored
sure, there is a risk on any trade, i don't know anyone who takes only 100% sure trades. i have the tp just below the previous swing high on h4, wich is also a 100 fibonaci extension of the previous impulse up, and if it breaks it i will wait for the next retracement. as you can see in the screenshot it's going well by now
later edit: hit my tp
good to hear that.the broker problem that i dont know what to do about it, because brokers get their data chart from different liquidity that may have some pips different broker to broker . the best solution i think,we check our broker,if all of us with broker 1 and 2 and 3 and 4 get same signal but broker 5 no signal,we can ignore broker 5,or we can use one of broker 1-4 for get signal and trade on whatever broker that we want. im open for other solution guys...
Ignored
Hi BTM,
I think this is a very good idea in order to optimize this method. Do you think it's useful to add on page one a list with "good" brokers ?
{quote} Zed.fr (https://www.forexfactory.com/zed.fr) where are you man ,come here need some help here.
Ignored
i' m comming... !! i leave in other part of the world... when you are working i'm sleeping... when i work you are sleeping .. :=)
in fact the value of Upper band and Lower band ( V ) in dash board is just a pondered average of the last value of the band (v4) , 8 hour (v8) and 12 hours ( v12) computing indicator "D" . the yellow band.
V = ( v12 + v8 + ( v4*2 ) ) / 4
It enough to calculate the trend . but if someone have better view to calcultate it . i'm taking it. but i have made a lot of test , it seems to be the better way to found the trend.
When the value if >0.00009 point or <-0.00009 point . we are in trend.
Hi BTM and zed.fr, Thanks for the dashboard, it's a great help to find trades (and to minimize CPU load ) I have a question concerning the values of trend band in the dashboard : {image} We are in a trend when these values are above 0.00010 or below -0.00010 Don't we miss a lot of trades with this limitation ? expecially those at the beginning of a trend ? or on pairs where these values will rarely exceed these limits. like on AUDUSD for example where we don't have alert on those potential trades : {image} Would it be possible in the dashboard's...
Ignored
Hi Akangela,
the calculation explain the post before. you will not miss a trade .
the trade appears if the band are in correct momentum . it's just apply the rule in post 1 about trend.
{quote} When the value if >0.00009 point or <-0.00009 point . we are in trend.
Ignored
Probably Arkangela's wish is to have custom values for these two trigger limits, introduced by trader in expert's parameters .... Maybe there are good trades for 0.00005, for example ...
{quote} Probably Arkangela's wish is to have custom values for these two trigger limits, introduced by trader in expert's parameters .... Maybe there are good trades for 0.00005, for example ...
Ignored
if value is betwin <00009 and >-0.00009 you will see on graph a flat yellow band . so No Trend because flat. Rule 1 .
i can put a custom value of this in the version of dash if you request it. but it seem not really good on my view.
{quote} i' m comming... !! i leave in other part of the world... when you are working i'm sleeping... when i work you are sleeping .. :=) in fact the value of Upper band and Lower band ( V ) in dash board is just a pondered average of the last value of the band (v4) , 8 hour (v8) and 12 hours ( v12) computing indicator "D" . the yellow band. V = ( v12 + v8 + ( v4*2 ) ) / 4 It enough to calculate the trend . but if someone have better view to calcultate it . i'm taking it. but i have made a lot of test , it seems to be the better way to found the...
Ignored
im so sorry man,i didn't want to bother you.thanks for coming and helped .
{quote} Hi BTM, I think this is a very good idea in order to optimize this method. Do you think it's useful to add on page one a list with "good" brokers ? Cheers
Ignored
it can possible but creating pol for this issue maybe not good enough.we must, for example, choose one chart and post its screen that shows arrows here with different brokers,then we can decide which one is better about data .
{quote} if value is betwin <00009 and >-0.00009 you will see on graph a flat yellow band . so No Trend because flat. Rule 1 . i can put a custom value of this in the version of dash if you request it. but it seem not really good on my view.
Ignored
zed.fr you are a coder and you know about inside,if it will confuse people please dont do that. lets do as a standard .
{quote} zed.fr you are a coder and you know about inside,if it will confuse people please dont do that. lets do as a standard .
Ignored
Yes For sure !! it not a god idea.
i have made several test before taking those value.
no trade will be missed with this method of calculation and value at 0.00009 and -0.00009.
i test it since 2 week full time with those value . and i 'm sure of what i said !
i can put a custom value of this in the version of dash if you request it. but it seem not really good on my view.
Ignored
Well, I think this would be interesting for some people to test ( and there is also an advantage in having a "measurable" trend/range condition ), but in this case I would suggest you to display the actual trigger values somewhere in the table header, or otherwise there will be some misunderstandings between trader 1 which works with 0.00009 and trader 2 which works with 0.00007 and there will be questions like "why do I have this trade notification and you don't have it?..." ....
But if the values are displayed in the table header, it's simple: the trader post a table screenshot and we can see: "oh, you work with 0.00007, so that's why ... "
Just a suggestion ...
Cheers
EDIT: OK, I read the comment from BTM, and I agree, so forget it!