NEWS High Impact News in 13 hrs
DAILY CHART - DATE: Tues 28th Aug 2019
ROMAR: Resistance
EMA: Resistance
Parabolic: Resistance
Check List:
Last MACD 0 Crossing Up
Last EMA Alert Arrow Down
Last DB Attachment Low – 116.551
Fibo up or down Up
NOTES: Downtrend with recent DB, SAR, Std and Hidden Divergences attached at LG box.
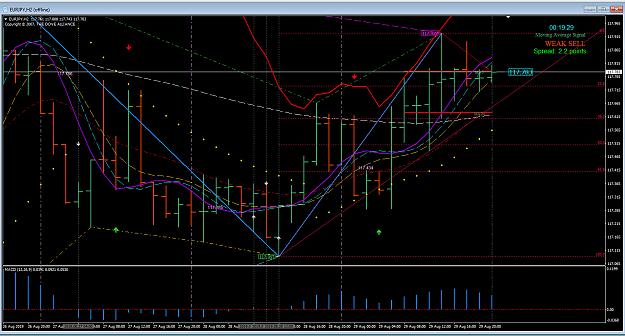
4 HOUR CHART:
ROMAR: Resistance
EMA: Resistance
Parabolic: Resistance
Check List:
Last MACD 0 Crossing Down
Last EMA Alert Arrow
Last DB Attachment Low – 116.551
Fibo up or down Up
NOTES: 4 HM strong downtrend. Market retraced to Purple and returned to trend.
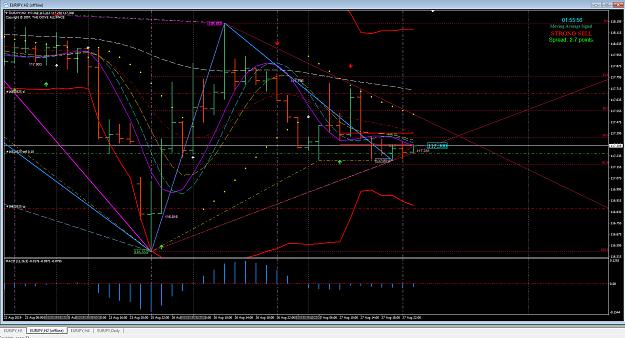
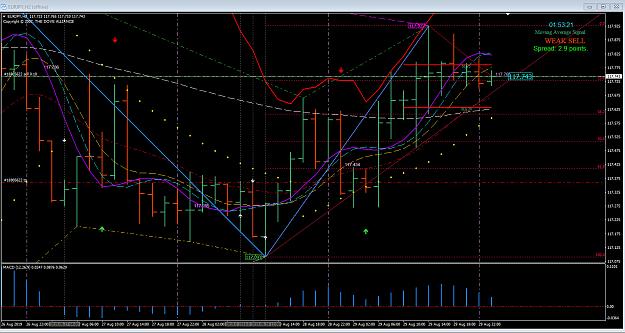
2 HOUR CHART:
Opening Price: 117.285
ROMAR: Resistance
EMA: Resistance
Parabolic: Resistance
Check List:
Last MACD 0 Crossing Down
Last EMA Alert Arrow Down
Last DB Attachment Low – 117.201
Fibo up or down Down
NOTES: DB/SAR running together. Attached at 61.8 red Fib support with Std and Hidden Divergence.
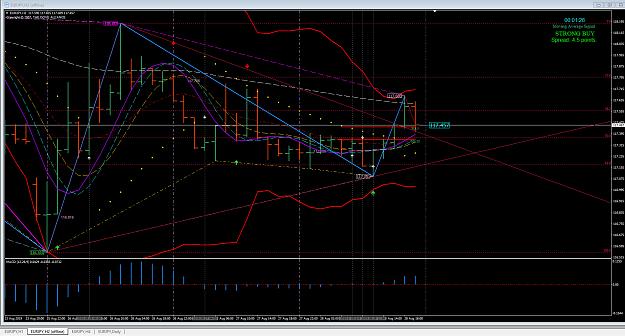
1 HOUR CHART:
ROMAR: Resistance
EMA: Resistance
Parabolic: Resistance
Check List:
Last MACD 0 Crossing Down
Last EMA Alert Arrow Down
Last DB Attachment N/A
Fibo up or down Up
NOTES: Market remains below 4 HM resistance. Market hit Purple resistance and turned back down.
NOTES (All four charts): Overall ROMAR, EMA and Parabolic downtrend but Fibs green on Daily, H4 and H1. Red on H2. Market is in a downtrend consolidation, ranging between Daily resistance (Parabolic, EMA, 4 HM, 23.6 Fib) and support at 0.0 Fib although this bumped down 2 days ago.
Trading Chart: Downtrend with market below 4 HM resistance. DB has attached with both Divergences but in downtrend on all charts this can continue lower. BB’s expanding.
Entry: Short on next open bar.
DAILY CHART - DATE: Tues 28th Aug 2019
ROMAR: Resistance
EMA: Resistance
Parabolic: Resistance
Check List:
Last MACD 0 Crossing Up
Last EMA Alert Arrow Down
Last DB Attachment Low – 116.551
Fibo up or down Up
NOTES: Downtrend with recent DB, SAR, Std and Hidden Divergences attached at LG box.
4 HOUR CHART:
ROMAR: Resistance
EMA: Resistance
Parabolic: Resistance
Check List:
Last MACD 0 Crossing Down
Last EMA Alert Arrow
Last DB Attachment Low – 116.551
Fibo up or down Up
NOTES: 4 HM strong downtrend. Market retraced to Purple and returned to trend.
2 HOUR CHART:
Opening Price: 117.285
ROMAR: Resistance
EMA: Resistance
Parabolic: Resistance
Check List:
Last MACD 0 Crossing Down
Last EMA Alert Arrow Down
Last DB Attachment Low – 117.201
Fibo up or down Down
NOTES: DB/SAR running together. Attached at 61.8 red Fib support with Std and Hidden Divergence.
1 HOUR CHART:
ROMAR: Resistance
EMA: Resistance
Parabolic: Resistance
Check List:
Last MACD 0 Crossing Down
Last EMA Alert Arrow Down
Last DB Attachment N/A
Fibo up or down Up
NOTES: Market remains below 4 HM resistance. Market hit Purple resistance and turned back down.
NOTES (All four charts): Overall ROMAR, EMA and Parabolic downtrend but Fibs green on Daily, H4 and H1. Red on H2. Market is in a downtrend consolidation, ranging between Daily resistance (Parabolic, EMA, 4 HM, 23.6 Fib) and support at 0.0 Fib although this bumped down 2 days ago.
Trading Chart: Downtrend with market below 4 HM resistance. DB has attached with both Divergences but in downtrend on all charts this can continue lower. BB’s expanding.
Entry: Short on next open bar.