{quote} Thx Alan, i completely understand why you draw the second triangle (i admit i didn't see it untill now) but does that mean that the triangles i draw aren't valid?
Ignored
Yes. We cannot just draw the lines to make things look nice they have to be based on the criteria I have explained.
{quote} alan i have been searching this thread looking for information on the destination/price target tool you have on your chart. is there a post i can read where you taught how to use it?
Ignored
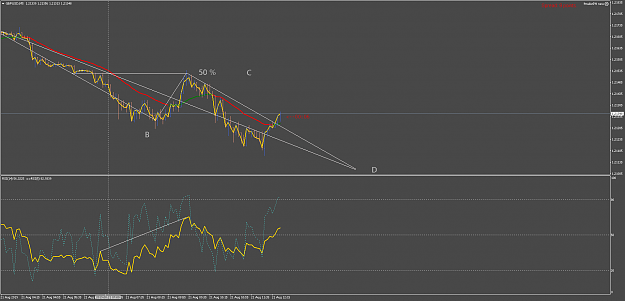
There is no tool here it is drawn by hand being an ABCD triangle and the target is equal to AB from C with the 50% distance also of interest.
{quote} alan i have been searching this thread looking for information on the destination/price target tool you have on your chart. is there a post i can read where you taught how to use it?
Ignored
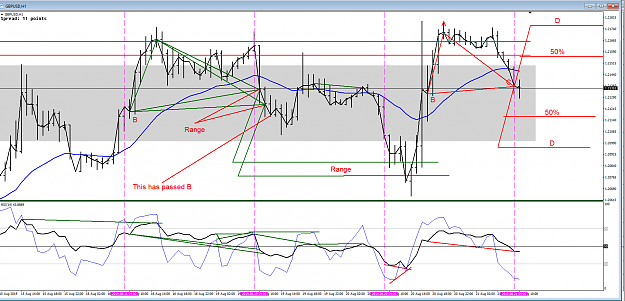
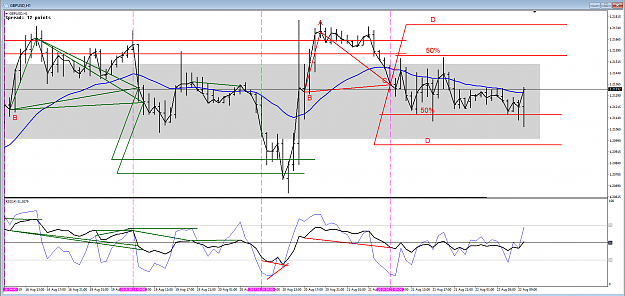
Today on the 1 hour chart we see another ABC triangle where.
C is higher than B on the price and they are on opposite sides of the EMA.
On the RSI we see C is lower than B so we have divergence and can complete the triangle on the price chart.
Then we simply copy the AB line and place it both above and below the C point of the triangle to give us D the target destination.
Its trading below the ema on H1 so main direction is short, but there's no bear support yet so can we say that this can go both ways and we have to wait for clearer signals (reg bul div M5 indicating it can go up to its ema)
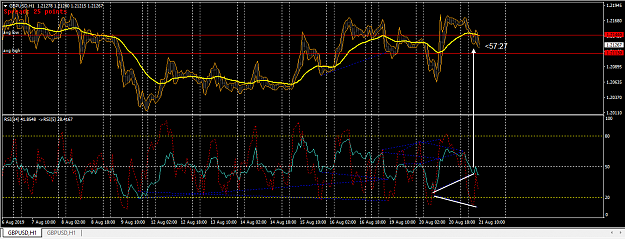
Can someone tell me why price never rise though, the 1H and 5m (and 15m) were giving bullish signals. {image} {image}
Ignored
That bull signal H1 took price back to its ema while that bar made a bear support and both price and rsi found resistance at its levels. Thats what i was thinking entering short at that time. By now i should have hedged that short once that bull RSI/RSI H1 signal was given, but i wasn't babysitting my trade.
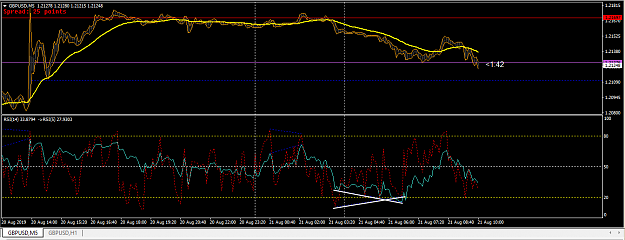
{quote} Your 5 min chart fails to show the bull div when the 1 hour reached the 50% {image} {image}
Ignored
so true Alan, its just like a puzzle where all the pieces fits. Great example again how the higher tf interacts with the lower one, or vice versa. But so many eyes needed
{quote} I just checked it, and no there was no hidden. Oh I missed the second question and yes the following bar was so we have a range of targets about 2 pips wide Duh!
{quote} I can't make any sense of your charts. Dark blue on black, High low EMA's, Zoomed too far out to even see the what you are talking about. Really if you cannot be bothered to set your charts up clearly why would anyone be bothered to try to read them.
Ignored
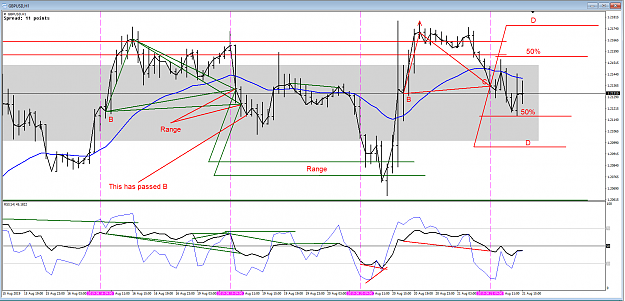
you can't see those white lines i drew on my charts showing div and the avg low?
{quote} does using the entire chart make it harder to read? i'm just trying to understand. if you don't want to help by finding fault that's find.
Ignored
Hi blessedchuck
I suggest you re-read post #4412
"I can't make any sense of your charts"
Why?
1/- "Dark blue on black", solution - choose better contrasting colours.
2/- High low EMA's, solution - use ema's/sma's of the closing price.
3/- "Zoomed too far out", solution - zoom in.
Some people will be reading this thread with large monitors, some with laptops, some with tablets and some just on their phones. The clearer and easier the charts are to read, the better for everyone.
David