NEWS No high impact news today
DAILY CHART - DATE: Tues 20th August 2019
ROMAR: Resistance
EMA: Resistance
Parabolic: Resistance
Check List:
Last MACD 0 Crossing Up
Last EMA Alert Arrow Down
Last DB Attachment Low 117.505
Fibo up or down Up
NOTES: ROMAR out of trading area. 4 HM in a slider, Fibo up but market meeting resistance.
4 HOUR CHART:
ROMAR: Resistance
EMA: Support
Parabolic: Support
Check List:
Last MACD 0 Crossing Up
Last EMA Alert Arrow
Last DB Attachment High 118.465
Fibo up or down Down
NOTES: White at Purple to eliminate Parabolic if it completes the crossing.
61.8 Fib resistance. EMA is support.
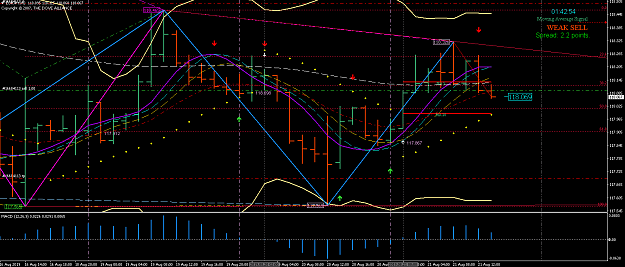
2 HOUR CHART:
Opening Price: 118.098
ROMAR: Resistance
EMA: Support with Purple, Resistance with ROMAR
Parabolic: Support ( eliminated with White crossing Purple)
Check List:
Last MACD 0 Crossing Up
Last EMA Alert Arrow Up
Last DB Attachment High 118.464
Fibo up or down Up
NOTES: Market has reached ROMAR and ROMAR is running through the center of the trading area. SAR has detached from the DB.
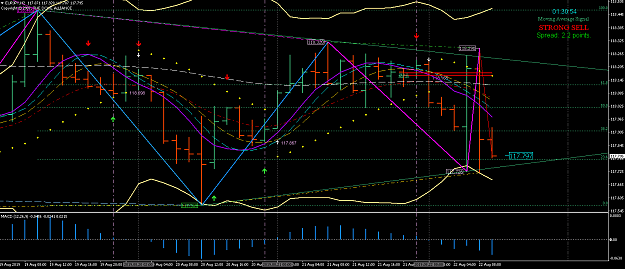
1 HOUR CHART:
ROMAR: Support
EMA: Resistance with Purple, Support with ROMAR
Parabolic: Resistance (eliminated with White crossing Purple)
Check List:
Last MACD 0 Crossing Down
Last EMA Alert Arrow Up
Last DB Attachment N/A
Fibo up or down Down
NOTES: ROMAR running through the center of the trading area.
NOTES (All four charts): The market is in consolidation.
Last DB attachment on the H2 (trading chart) was high.
Market is currently ‘in the middle’.
Entry: Wait for a DB attachment low on the H2 and look for an entry to go long.
DAILY CHART - DATE: Tues 20th August 2019
ROMAR: Resistance
EMA: Resistance
Parabolic: Resistance
Check List:
Last MACD 0 Crossing Up
Last EMA Alert Arrow Down
Last DB Attachment Low 117.505
Fibo up or down Up
NOTES: ROMAR out of trading area. 4 HM in a slider, Fibo up but market meeting resistance.
4 HOUR CHART:
ROMAR: Resistance
EMA: Support
Parabolic: Support
Check List:
Last MACD 0 Crossing Up
Last EMA Alert Arrow
Last DB Attachment High 118.465
Fibo up or down Down
NOTES: White at Purple to eliminate Parabolic if it completes the crossing.
61.8 Fib resistance. EMA is support.
2 HOUR CHART:
Opening Price: 118.098
ROMAR: Resistance
EMA: Support with Purple, Resistance with ROMAR
Parabolic: Support ( eliminated with White crossing Purple)
Check List:
Last MACD 0 Crossing Up
Last EMA Alert Arrow Up
Last DB Attachment High 118.464
Fibo up or down Up
NOTES: Market has reached ROMAR and ROMAR is running through the center of the trading area. SAR has detached from the DB.
1 HOUR CHART:
ROMAR: Support
EMA: Resistance with Purple, Support with ROMAR
Parabolic: Resistance (eliminated with White crossing Purple)
Check List:
Last MACD 0 Crossing Down
Last EMA Alert Arrow Up
Last DB Attachment N/A
Fibo up or down Down
NOTES: ROMAR running through the center of the trading area.
NOTES (All four charts): The market is in consolidation.
Last DB attachment on the H2 (trading chart) was high.
Market is currently ‘in the middle’.
Entry: Wait for a DB attachment low on the H2 and look for an entry to go long.