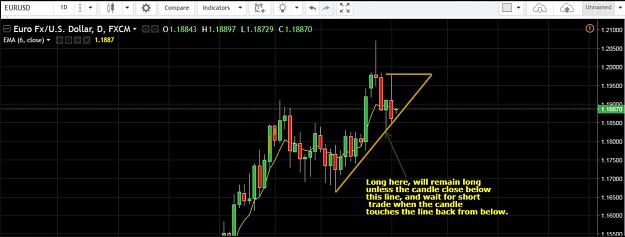
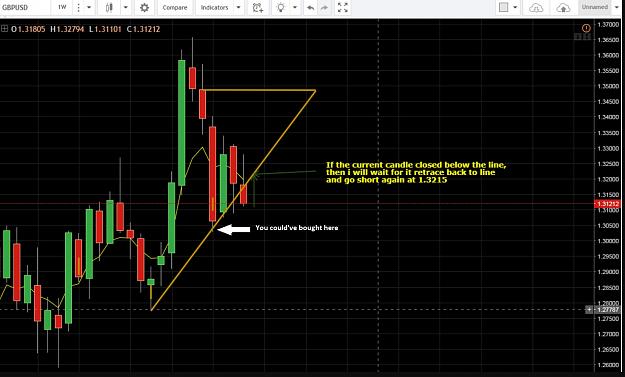
When do you decide to go long or short? Is it when the wick touched the trendline inside or outside the triangle? On the examples you posted before (see screenshot attached), I noticed that you were placing orders while the candle is still inside the triangle. Some when the candle closes outside it then wait for retest.
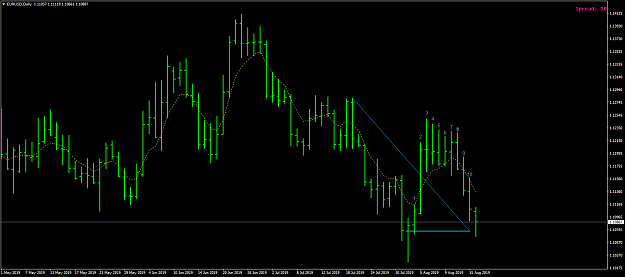
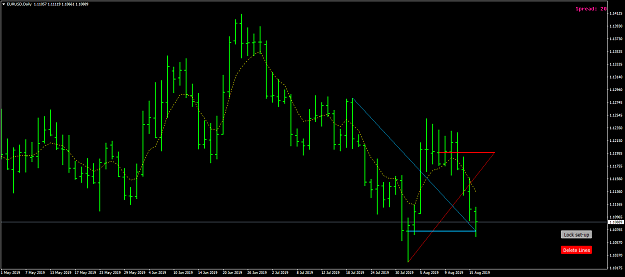
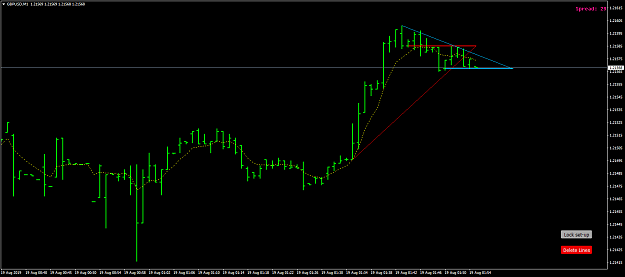
Hello guys, In my spare time I made this indicator according to the rules given, it is only in the initial phase, but it seems to work well. If you want to show passed set-up, use the shift parameter to set the starting candle from which to search for the signal, like this one on EUR USD (shift 5), or the second (shift 10) {image} {image} {file}
Ignored
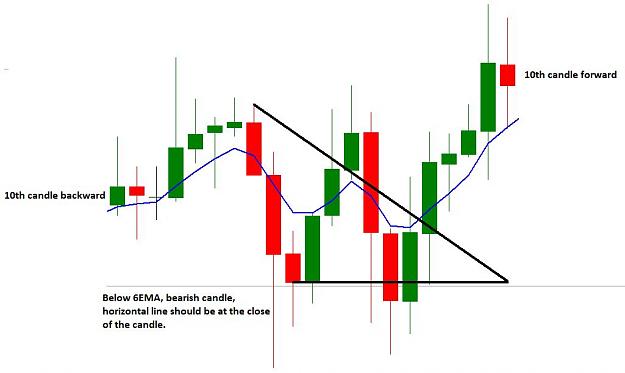
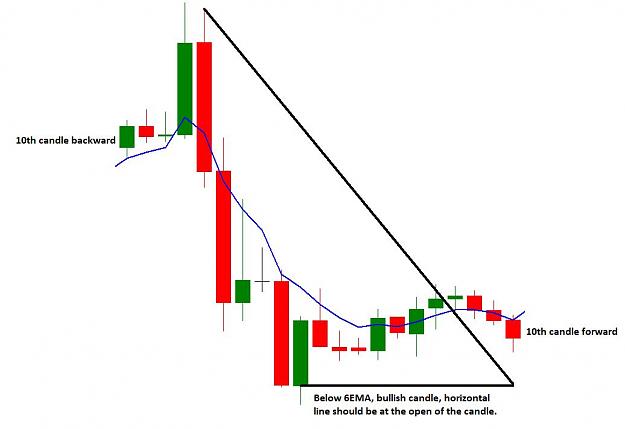
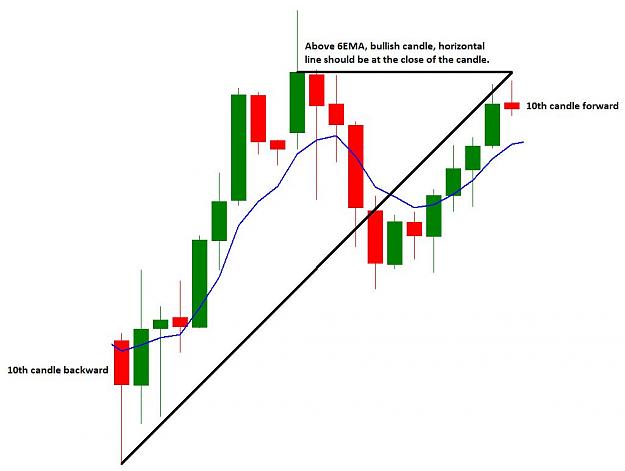
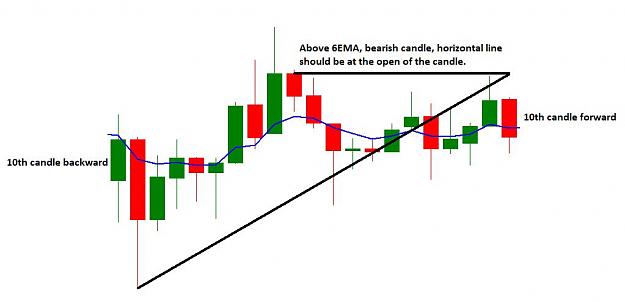
Bro, I think you need to adjust your indi as it only counts 9 candles forward from the candle touching the 6 EMA. Also, the horizontal line should be drawn from the open/close of the candle not touching the 6 EMA, following these examples. See attached images.
Hi Abhirag, When do you decide to go long or short? Is it when the wick touched the trendline inside or outside the triangle? On the examples you posted before (see screenshot attached), I noticed that you were placing orders while the candle is still inside the triangle. Some when the candle closes outside it then wait for retest. Also, where do you place your TP and SL? Thanks. {image} {image}
Ignored
When the candle's wick touches from outside the triangle.
{quote} Bro, I think you need to adjust your indi as it only counts 9 candles forward from the candle touching the 6 EMA. Also, the horizontal line should be drawn from the open/close of the candle not touching the 6 EMA, following these examples. See attached images. Correct me if I'm wrong here, Abhirag. Thanks!
Ignored
First of all thnks to all the persons taht apreciated my indi and left feedback.
For the first point, You are right I count the touching EMA' bar as candle one, but readind better what Abhirag wrote it should be candle zero, I'll do the modification, about the second point isn't so clear because, as I worte, Abhirag told (in capital letter) on post 31 to use the open of the non touching EMA candle, He did'nt told to use the lowest value from open and close.
Ok Guys, I modified the forward count of candle now it'scorrect.
Working on code I added some new stuff, because the indicator is looking for a set-up on every new candle, it's possible that a new set-up will form and deleting old set-up. For preventing this situation I added 2 button 1) lock set-up and 2) delete all lines. The first button lock the current set-up on specific time frame so if a new set-up is forming, the old remain there, You can use also this button to show more than one set-up without using two or more indicator; simply change the shift parameter, and click on lock set-up button. The button "delete lines" is self explaniatory. Enjoy
P.S. For those dowloaded the first release please re download and subsititute the old file
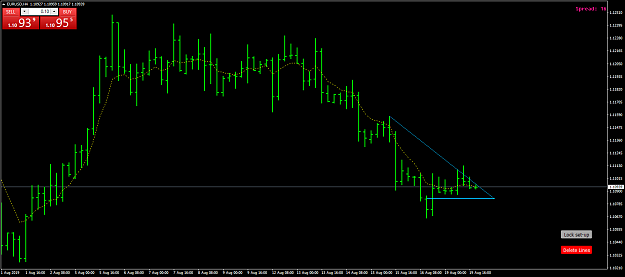
this is an example of how to use one indicator to show 2 or more set-up on a specifIed TF :
in this graph I used first shift 5 parameter, then i clicked on the button "lock set-up", then I changed the shift to 10.
I repeat myself, every locked set-up will be shown ONLY on the TF was saved, to leave chart clean on the others TF.
P.S. 2 sorry guys with market open I found some problems that now are solved, the attached indi is now working ok.
Thanks to abhirag for this strategy, testing the indicator on TF 1 min, it's clear that the levels indicated are respected and important (I used TF 1min only for testing purpose)
Thanks to abhirag for this strategy, testing the indicator on TF 1 min, it's clear that the levels indicated are respected and important (I used TF 1min only for testing purpose) {image}
Ignored
Thanks Vitto for this indicator. It seems simple and elegant.
What purpose does the shift function serve? It seems to move the 10 candle count back in time, but why would we ever want to do this?
{quote} 1. Identify the candle not touching 6 EMA. 2. Wait for next candles to touch the 6 EMA. 3. From the candle touching the 6 EMA count 10 candles forward and 10 candle backward. From the OPEN of candle (Not touching 6EMA) draw a straight line upto 10 candle forward (From the candle touching 6EMA). 4. From the end of straight line drawn (10 candles forward), try to draw a line touching high or low of backward candles. it will form a triangle. 5. Now if the candle is touching the line from above (Depends upon how the setup is) go LONG the moment...
Ignored
Abhirag,
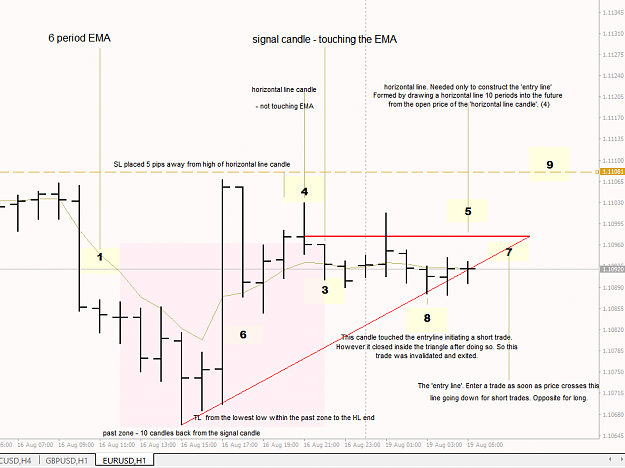
Here is my attempt to explain your system; will you please let me know if I have the correct details?
On a chart with a 6 period EMA...
A valid signal is generated when a candle touches the EMA whose immediate neighbour is NOT touching the EMA.
The candle touching the EMA is the 'signal candle'.
The candle prior to the signal candle is the 'horizontal line candle'.
Draw a horizontal line forward in time 10 candles from the opening price of the horizontal line candle. This is the 'horizontal line'.
10 candles backward in time from the signal candle is the 'past zone'.
Draw a trendline starting from the end of the horizontal line that is not touching the horizontal line candle to the highest high (for long trades) or the lowest low (for short trades) found within the 'past zone'. This trendline is the 'entry line'.
Enter when price crosses the 'entry line'.
Place your SL 5 pips below the low of the horizontal line candle for long trades or 5 pips above the high of the horizontal line candle for short trades.
Exit a trade when price crosses the entryline but closes inside the triangle formed by the entryline and the horizontal line. Does this mean for any future candle or only on the candle which initiated the trade?
{quote} Abhirag, Here is my attempt to explain your system; will you please let me know if I have the correct details? On a chart with a 6 period EMA... A valid signal is generated when a candle touches the EMA whose immediate neighbour is NOT touching the EMA. The candle touching the EMA is the 'signal candle'. The candle prior to the signal candle is the 'horizontal line candle'. Draw a horizontal line forward in time 10 candles from the opening price of the horizontal line candle. This is the 'horizontal line'. 10 candles backward in time from...
Ignored
Thanks Clemmo, yes, the explanation is on spot. The trade should be closed if any candle closes inside the triangle OR if hit the SL.
{quote} What if the price once again crosses the entry line should the trade be put on again or wait for a different setup?
Ignored
Sorry, didn't really get the question. We go long/short when the price touches the Triangle, and get out of the trade if the candle closes inside the triangle.
{quote} Sorry, didn't really get the question. We go long/short when the price touches the Triangle, and get out of the trade if the candle closes inside the triangle.
Ignored
Thanks for your patience with my questions.
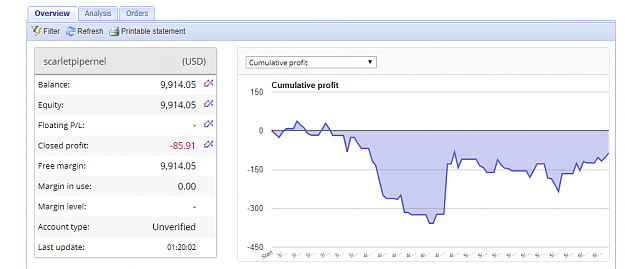
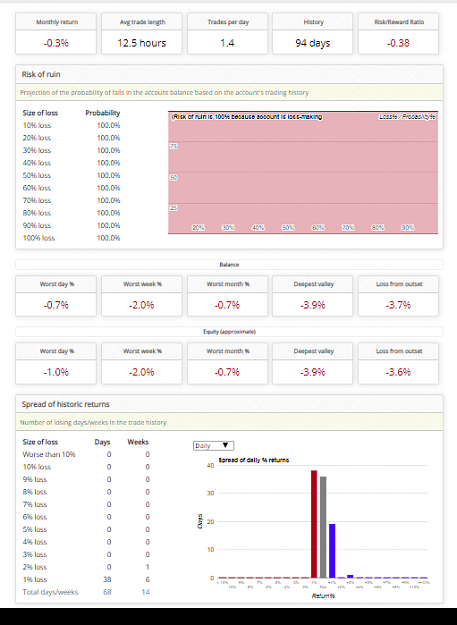
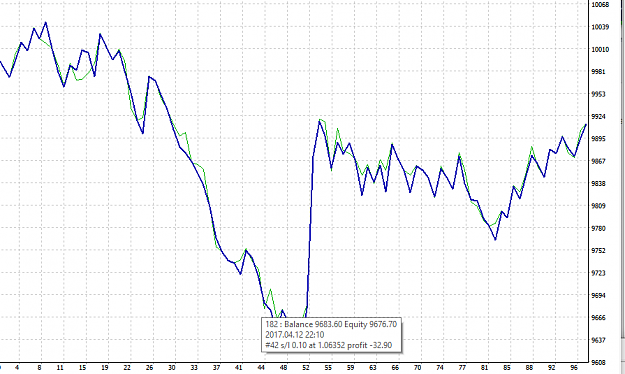
Based on that, I made a 100 trade backtest using EU H1 from a random starting date (2017.03.07) using 1:2 risk:reward.
Attached Image (click to enlarge)
Attached Image (click to enlarge)
Attached Image (click to enlarge)
Attached Image (click to enlarge)
Note the recovery that occurs around trade 51 is the result of the EU price spike on 2017.04.24 mostly a lucky result.
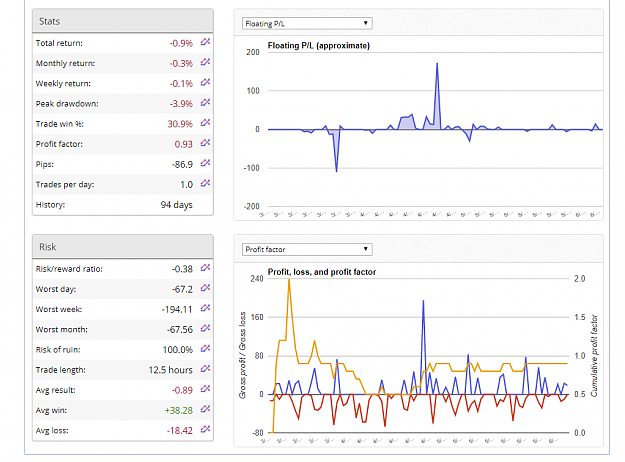
The results appear to be random which conforms to my initial intuition about this system.
Some possible reasons:
This period of time was somehow not conducive to the strategy
A 6 period MA is not sufficient to filter out random moves and is essentially random
The crossing of a 6 period MA is therefore not significant
The candle prior to the candle that crossed the MA is also not significant and a 5 pip SL placed above it is fairly tight on H1, likely to get hit often.
During ranges results are close to random but during trends they are slightly worse than random because counter-trend trades will signal more often. This is because your setup requires price to be on the counter-trend side of the MA before a signal can be produced, but price will spend more time on the trend-side of the MA, going for longer periods without crossing back, which is to be expected from a trend.
In any case I don't know how this system could be 'very profitable' and I urge you to use caution if you decide to continue trading it.
{quote} Abhirag, Here is my attempt to explain your system; will you please let me know if I have the correct details? On a chart with a 6 period EMA... A valid signal is generated when a candle touches the EMA whose immediate neighbour is NOT touching the EMA. The candle touching the EMA is the 'signal candle'. The candle prior to the signal candle is the 'horizontal line candle'. Draw a horizontal line forward in time 10 candles from the opening price of the horizontal line candle. This is the 'horizontal line'. 10 candles backward in time from...
Ignored
the point nbr 8 is wrong, you enter a trade when a candle close over the triangle line, and then touch it.
{quote} Thanks Vitto for this indicator. It seems simple and elegant. What purpose does the shift function serve? It seems to move the 10 candle count back in time, but why would we ever want to do this?
Ignored
This is useful if You want to see a past set-up that it's still valid, look at my previous example on EUR-USD Daily.