• Home
  • Forums
  • Trades
  • News
  • Calendar
  • Market
  • Brokers
  • Login
  • Join
  • User/Email: Password:
  • 2:54am
Menu
  • Forums
  • Trades
  • News
  • Calendar
  • Market
  • Brokers
  • Login
  • Join
  • 2:54am
Sister Sites
  • Metals Mine
  • Energy EXCH
  • Crypto Craft

Options

Bookmark Thread

First Page First Unread Last Page Last Post

Print Thread

  • Trading Systems
  • /
  • Reply to Thread
  • Subscribe
  • 6
Attachments: p=mv
Exit Attachments
Tags: p=mv
Cancel

p=mv

  • Post #1
  • Quote
  • First Post: Edited Aug 12, 2019 10:20am Aug 8, 2019 6:26am | Edited Aug 12, 2019 10:20am
  •  jxp
  • | Joined Jan 2019 | Status: Member | 16 Posts
Attached Image (click to enlarge)
Click to Enlarge

Name: Line Graph.png
Size: 16 KB


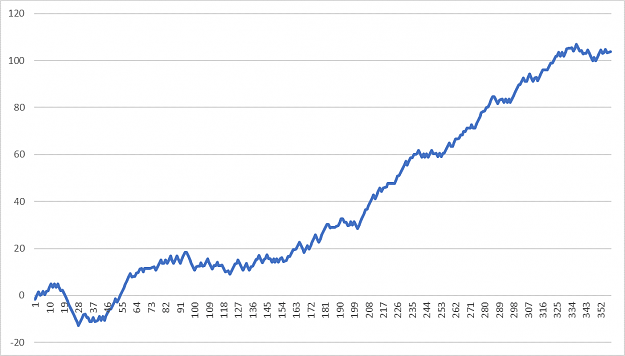
The graph above is test results from this trading plan – tested over 5.5 month period and 32 currency pairs at 1.5% risk per trade. In reality, this result is not feasible due to the number of pairs involved and the number of trades in one day (max 8 trades in one day)/the margin that would be required at 1:30/20 leverage, let alone the exposure on your account any one point. However, I wanted to continue testing until the results surpassed 100% at 1.5% risk as proof of concept. Breaking this down further, profitable trades account for 45% of trades, losses 28% and breakeven 26% - however, my breakeven trades are small profits at 0.25% (explained later).

The Plan

Shortlisting

Attached Image (click to enlarge)
Click to Enlarge

Name: 1.png
Size: 146 KB


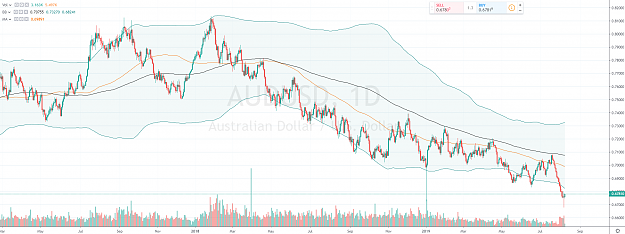
I do not trade markets that are ‘over-extended’ as I feel that prices are more erratic. To shortlist markets, my plan starts with the daily chart and Bollinger Bands (BB) (Length 200, StdDev 2).

I am looking to avoid entering continuation trades where a reversal is likely to occur. If the current price is outside of the BB (upper or lower band), as it is at the time of writing this on AUDUSD, I will not trade that market. I will also not enter a trade where either the stop loss or profit target surpasses the BB or the 200-day SMA.

Trade Setups

Attached Image (click to enlarge)
Click to Enlarge

Name: 2.png
Size: 433 KB


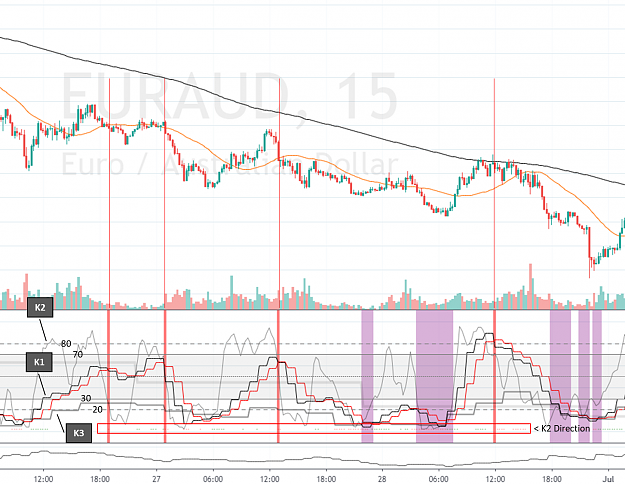
Once the markets have been shortlisted, I move the 15M charts with my own system which is based on momentum at three different resolutions; 15M (K2), 1H (K1) and 3H (K3). There are inherent ‘repaint’ issues that must be addressed when dealing with data at different resolutions – explained later.

When looking for trend continuation in a downtrend, I want to see good downward momentum with a tight pull-back and a way to confirm continuation. I do this by waiting for a specific setup structure.

The following structure must be met for a valid setup: K3 must be within the range of 20 – 30 (short) and 70 – 80 (long), K2 must then reach the relevant upper/lower bound (>80/<20), followed by a K1 crossover. The dots along the bottom confirm where K2 is aligned with K1, dots do not appear where K2 is in the upper/lower bounds and K1 is not – this is to avoid opening a position where a reaction to K2 may cause a short-term pull-back. The setup structure must form with a K2 direction dot at the XX:45 close to confirm a setup. I give K2 another hour to align if it is not aligned at the initial setup structure.

Attached Image (click to enlarge)
Click to Enlarge

Name: 3.png
Size: 95 KB


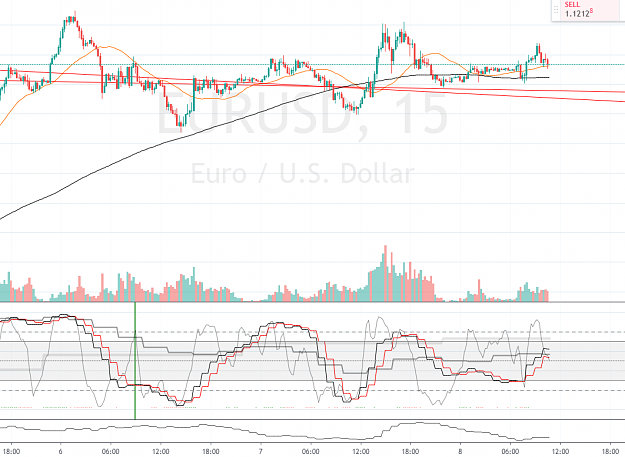
This setup structure allows me to only enter trades where there is data-backed momentum. If a market flattens out it is reflected in the data and signals are not created which does an okay job of keeping you out of tight ranges on the lower timeframes.

I address repainting caused by multiple timeframe data by referencing the confirmed points. All setups are confirmed; thus, trades are made hourly. K3 referencing uses the last confirmed value for hour-1 and 2 and the current K3 value for hour-3.

Stop losses and profit targets are set based on the 1H ATR. I like this method as it provides dynamic levels that are suited to the market in question. I have experimented with several ATR multiples and 3-times 1H ATR works best for me and typically provides a stop level that surpasses the 200 15M SMA.
Once in a trade, an alert is set at 75% of the profit target, once the price surpasses this level, I move the stop loss to breakeven/0.25% profit. I do this for several reasons, including my targets are not based on market structure, I prefer to see small profits than zeros, spreads, and slippage.

Developments

- K3 Range Bounds: This is a recent development as I used to use the standard upper/lower bounds for all timeframes, whilst it performed okay, the number of trades were high where markets aligned which also led to larger drawdowns if multiple markets would reverse. The change is a stricter requirement for K3 and leads to setups with tighter pullbacks and lower overall exposure.

- Over-Extension Check: I have always used the daily BB to gauge over-extension, but I did trade the over-extended markets but at lower risk. However, over time I noticed that the de-risked trades equated to a small net loss. Removing them resulted in a slighter higher return and fewer trades.

Next Steps

I am looking to automate some parts of the plan, for example; shortlisting to be completed automatically which updates a list of markets within the required range. This sounds like something that could be accomplished with minimal effort.

Please send me a private message if you have any experience with Pine Script Strategies and feel you could assist with the development of this strategy.

Feel free to share your thoughts. Cheers.
p=mv
  • Post #2
  • Quote
  • Aug 8, 2019 9:05am Aug 8, 2019 9:05am
  •  razaali
  • Joined Mar 2013 | Status: Member | 693 Posts
Quoting jxp
Disliked
{image} The graph above is test results from this trading plan – tested over 5.5 month period and 32 currency pairs at 1.5% risk per trade. In reality, this result is not feasible due to the number of pairs involved and the number of trades in one day (max 8 trades in one day)/the margin that would be required at 1:30/20 leverage, let alone the exposure on your account any one point. However, I wanted to continue testing until the results surpassed 100% at 1.5% risk as proof of concept. Breaking this down further, profitable trades account for 45%...
Ignored
would you like to share your template?
 
 
  • Post #3
  • Quote
  • Aug 8, 2019 9:53am Aug 8, 2019 9:53am
  •  Fx-Gamer
  • | Additional Username | Joined Sep 2018 | 152 Posts
That looks impressive! Subscribed.
 
 
  • Post #4
  • Quote
  • Aug 8, 2019 1:04pm Aug 8, 2019 1:04pm
  •  jxp
  • | Joined Jan 2019 | Status: Member | 16 Posts
Quoting razaali
Disliked
{quote} would you like to share your template?
Ignored
Sorry, I do not use Metatrader.
p=mv
 
 
  • Post #5
  • Quote
  • Aug 9, 2019 2:53am Aug 9, 2019 2:53am
  •  jxp
  • | Joined Jan 2019 | Status: Member | 16 Posts
Quoting Fx-Gamer
Disliked
That looks impressive! Subscribed.
Ignored
Thank you, I will occasionally post updates. If you know of any experienced programmers, please refer them.
p=mv
 
 
  • Post #6
  • Quote
  • Aug 10, 2019 7:27am Aug 10, 2019 7:27am
  •  Barraka
  • Joined Jul 2017 | Status: Member | 241 Posts
You explain that you use a sl of 3xATR based on H1. But what about your TP, what ATR ratio do you use, or are you just going for a 1:1 R/R?
 
 
  • Post #7
  • Quote
  • Aug 12, 2019 2:56am Aug 12, 2019 2:56am
  •  jxp
  • | Joined Jan 2019 | Status: Member | 16 Posts
Quoting Barraka
Disliked
You explain that you use a sl of 3xATR based on H1. But what about your TP, what ATR ratio do you use, or are you just going for a 1:1 R/R?
Ignored
Yes, 1:1 works for me, that is what all my test results are based on. Sometimes I will close out partial position and run the trade if the TP is hit whilst K2 is in the extreme upper/lower bounds, closing out fully on a confirmed breach of this level.
p=mv
 
 
  • Post #8
  • Quote
  • Aug 12, 2019 5:20am Aug 12, 2019 5:20am
  •  TheCrusade
  • | Joined Mar 2016 | Status: Member | 84 Posts
Thanks for sharing your method it looks interesting.

I am not really sure if i understand how you find your valid setups.
Would you like to upload some more pictures with valid entries?

greetings
 
 
  • Post #9
  • Quote
  • Aug 12, 2019 5:42am Aug 12, 2019 5:42am
  •  jxp
  • | Joined Jan 2019 | Status: Member | 16 Posts
Attached Image (click to enlarge)
Click to Enlarge

Name: Picture1.png
Size: 645 KB


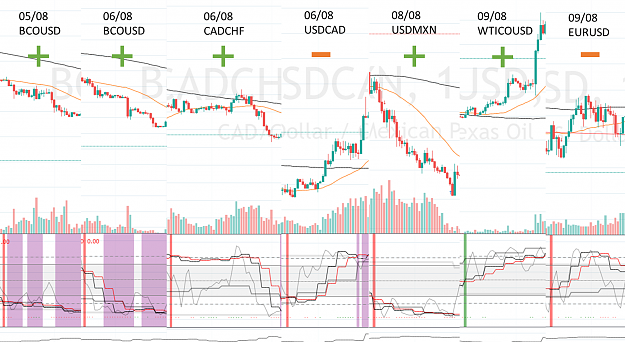
Last week's trades - good performance. Caught in some choppy price action in EURUSD/USDCAD.
p=mv
 
 
  • Post #10
  • Quote
  • Aug 12, 2019 5:50am Aug 12, 2019 5:50am
  •  jxp
  • | Joined Jan 2019 | Status: Member | 16 Posts
I spent some time last week reviewing the test data referenced in the OP. I commented on the fact that in reality, the results I posted are unrealistic. In response to this, I assessed days where more than 3 trades were placed (unfortunately, I cannot retrieve the exit times of the trades without re-running the tests which would make this even more accurate), retained the first 3 trades and removed the others - essentially, limiting trades per day to 3.

This resulted in the removal of 86 trades (272 versus 358) and a return of 85.9% versus 103.7% (1.5% risk per trade).
p=mv
 
 
  • Post #11
  • Quote
  • Aug 12, 2019 8:14am Aug 12, 2019 8:14am
  •  Soros
  • Joined Sep 2012 | Status: Edge,Phsycology And Money Managemen | 909 Posts
why not just create an EA for this simple
I am what Many Dream to be but only a few can achieve, im a part of the 1%
 
 
  • Post #12
  • Quote
  • Edited 6:36pm Aug 12, 2019 6:19pm | Edited 6:36pm
  •  Penguinthief
  • | Joined Jan 2018 | Status: Member | 70 Posts
What momentum indicator is that and what settings for K1/K2/K3? I assume just RSI with default settings?

What about the red line in the momentum, that K1 crosses with? What is that?
Will code in MT5 for free.. EAs only, can't be f*cked with Indicators
 
 
  • Post #13
  • Quote
  • Aug 19, 2019 7:06am Aug 19, 2019 7:06am
  •  jxp
  • | Joined Jan 2019 | Status: Member | 16 Posts
UPDATE: Good performance last week - 6 trades; 2 profits, 1 loss, and 3 breakevens.

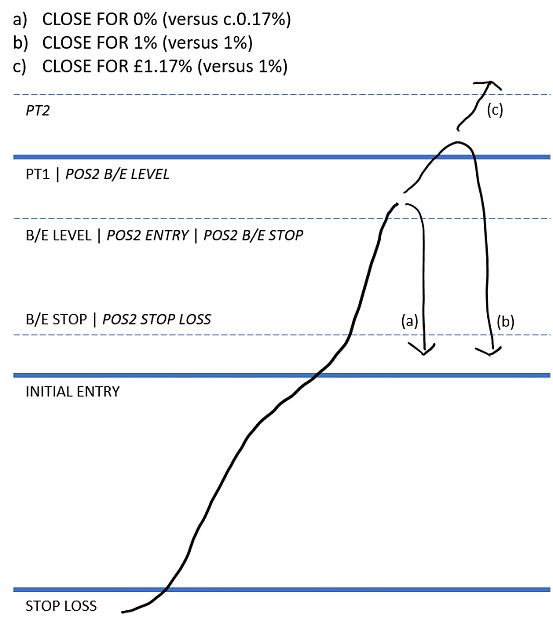
I have been exploring a 'safe' method of scaling into positions in a 'risk-off' scenario where running trades is less likely - diagram below. Edit: slight typo on the diagram - the £ symbol on scenario C should not be there.

Attached Image (click to enlarge)
Click to Enlarge

Name: Picture2.png
Size: 17 KB


Where I usually move the stop loss to around 17% - 20% of the initial profit target when the market hits the B/E level. My idea is instead to trigger a second position at my B/E level for the value of the secured profits from the initial trade, placing the stop loss for the second position at the B/E stop loss of the initial position. The market reverses at this point (scenario A), I am taken out for +0.17% and -0.17% simultaneously, i.e 0%.

Where the market proceeds to hit the initial profit target (scenario B), the initial trade is fully closed out. The stop loss for the second trade is moved to breakeven (entry point). If the market reverses at this point then the second trade is taking out for 0% while profits from the initial trade are banked.

Where the market extends a little further from the initial profit target and hits the secondary profit target, the secondary position is closed for the small additional profit

I am essentially sacrificing the small amount of profit from breakeven positions and adding it to profitable positions. This results in a performance improvement when applied to historical data and it is due to the quantity of profitable versus breakeven trades.
p=mv
 
 
  • Post #14
  • Quote
  • Last Post: Aug 26, 2020 5:32am Aug 26, 2020 5:32am
  •  chris420934
  • | Joined Mar 2016 | Status: Junior Member | 2 Posts
This looks like a very promising system. May I ask why K3 has to be in such a narrow range (20-30% for shorts, 70-80% for longs)?
 
 
  • Trading Systems
  • /
  • p=mv
  • Reply to Thread
0 traders viewing now
Top of Page
  • Facebook
  • Twitter
About FF
  • Mission
  • Products
  • User Guide
  • Media Kit
  • Blog
  • Contact
FF Products
  • Forums
  • Trades
  • Calendar
  • News
  • Market
  • Brokers
  • Trade Explorer
FF Website
  • Homepage
  • Search
  • Members
  • Report a Bug
Follow FF
  • Facebook
  • Twitter

FF Sister Sites:

  • Metals Mine
  • Energy EXCH
  • Crypto Craft

Forex Factory® is a brand of Fair Economy, Inc.

Terms of Service / ©2023