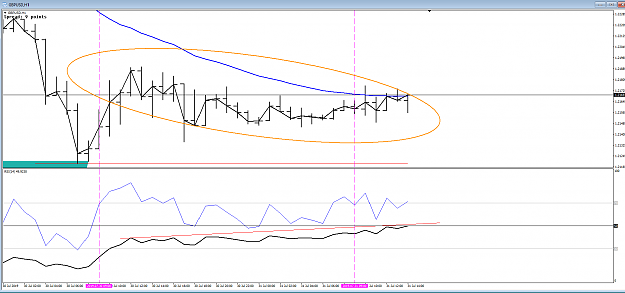
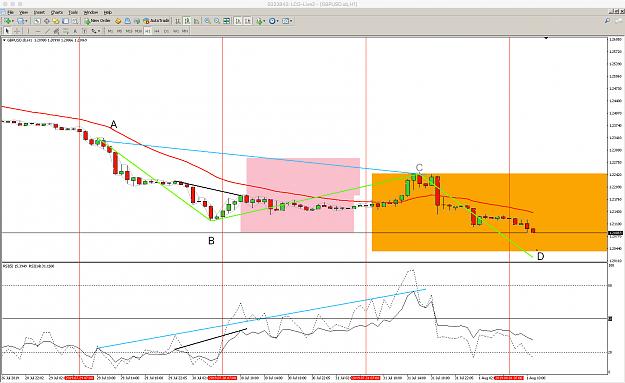
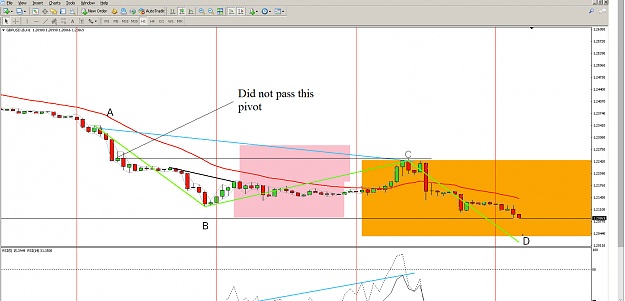
Disliked{quote} Because in real time you would not have known there was going to be a next one and this one was in divergence.Ignored
I can understand why huskyboy had the question.
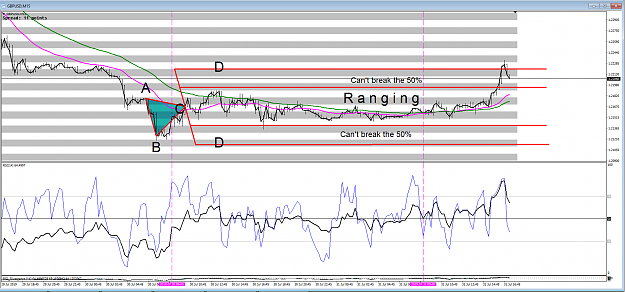
so equally, why do you take that bar at C and not the one before?
I think it is also in divergence.
Many thanks